EMA Indicator Strategy: How to Automate It Without Coding
The EMA indicator is one of the most widely used trend-following tools in trading. The 20/50 crossover keeps it simple. Two lines, one signal. When EMA(20) crosses above EMA(50), you enter. When it crosses below, you exit.
The problem is executing it consistently by hand. You miss signals when you step away. You hesitate when the move looks extended. By the end of the week, your results do not match your rules.
That is an execution problem, not a strategy problem. This guide shows you how to fix it by automating the EMA indicator strategy on AlgoTest Signals AI, no coding required
What Is the EMA Indicator?
EMA stands for Exponential Moving Average. It calculates a running average of price but gives more weight to recent candles. This makes it faster to respond to price changes than a Simple Moving Average, which is why most intraday traders prefer it.
Two EMAs together are more useful than one. A shorter EMA reacts quickly. A longer EMA reflects the broader trend. When the shorter crosses above the longer, momentum is shifting up. When it crosses below, momentum is shifting down.
Learn how to create trading signals with AI
Why the EMA 20/50 Crossover Works for Intraday Trading
The 20 EMA tracks short-term momentum. The 50 EMA tracks the medium-term trend. When EMA(20) crosses above EMA(50), short-term momentum has shifted above the medium-term trend, confirming bullish conditions. The reverse signals bearish momentum.
One thing to know upfront: EMA is a lagging indicator. It confirms a move after it has started. You will not catch the very first candle of a trend, and that is fine. The goal is to be on the right side of a confirmed move, not to be first.
Check out 5 Best Indicators for Intraday Trading
What You Need Before Automating the EMA Indicator Strategy
Lock down four things before you build anything.
Fast EMA: Period 20. This is your short-term momentum line.
Slow EMA: Period 50. This is your medium-term trend line.
Entry: EMA(20) crosses above EMA(50) on a 5-minute candle.
Exit: EMA(20) crosses below EMA(50).
Both use Close as the price source and OHLC candles on a 5-minute timeframe. These match the default settings in the AlgoTest Signals AI documentation, so your screenshots will line up exactly. If you have been tracking EMA crossovers manually on a charting platform, AlgoTest is one of the best TradingView alternatives in India that takes you from chart-watching to full automation.
For the full range of EMA indicator parameter options, including candle types, price sources, and offset settings, the complete documentation covers all of it.
Related: 7 Bollinger Bands Strategies for Indian Markets
How to Automate the EMA Indicator Crossover Strategy on Signals AI
AlgoTest Signals AI lets you build and automate indicator-based strategies through a visual condition builder. No Pine Script, no Python, no broker API setup. Everything from signal creation to backtesting to live execution runs inside one platform built for algo trading in India.
Here is the step-by-step process.
Step 1: Create a New Signal
Log in to AlgoTest and open Signals AI. Click Create Signal. Name it something you will recognise easily, like "EMA-20-50-Crossover-5min", especially if you plan to run multiple signals at the same time.
Set your timeframe to 5 minutes. This matches the EMA crossover strategy setup used in the Signals AI documentation.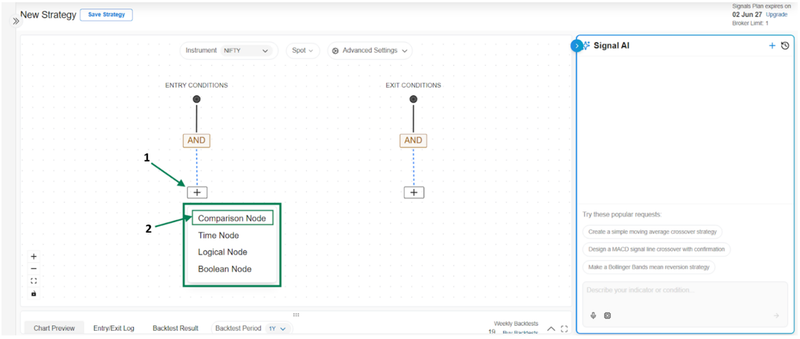
Step 2: Add the Fast EMA
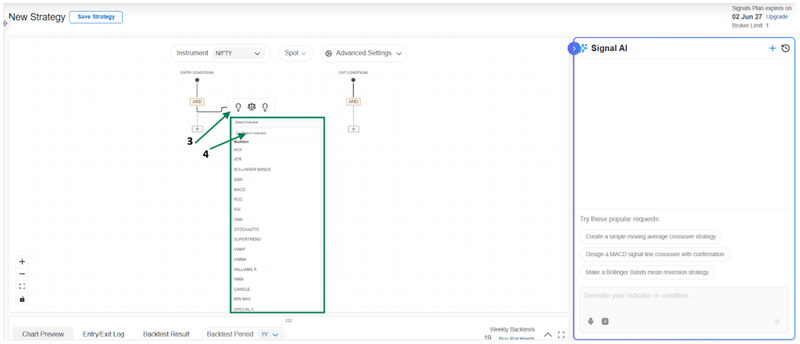
Under Entry Condition, click the plus sign and select Comparison Node. Search for EMA and select it.
Set the indicator inputs as follows.
Candle Type: OHLC
Source: Close
Period: 20
Timeframe: 5 minutes
Save the settings. This is your fast EMA, the short-term line that reacts quickly to price movement.
Step 3: Set the Comparison and Add the Slow EMA
After setting the fast EMA, select Crosses Above as your comparison operator.
Now add the slow EMA. Follow the same process, search for EMA and set the inputs as follows.
Candle Type: OHLC
Source: Close
Period: 50
Timeframe: 5 minutes
Save. Your entry condition is now complete. EMA(20) crosses above EMA(50) on a 5-minute chart.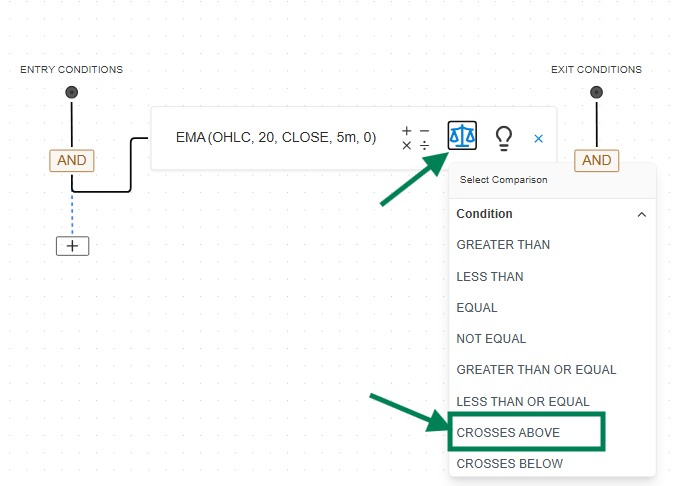
Step 4: Build Your Exit Condition
Under Exit Condition, repeat the same process.
Add EMA(20) with the same settings as before. Set the comparison to Crosses Below. Then add EMA(50) with the same inputs.
Your exit condition is now set. When EMA(20) drops below EMA(50), the position closes automatically. The entry and exit are mirror images of each other, one crossover gets you in, the opposite crossover gets you out.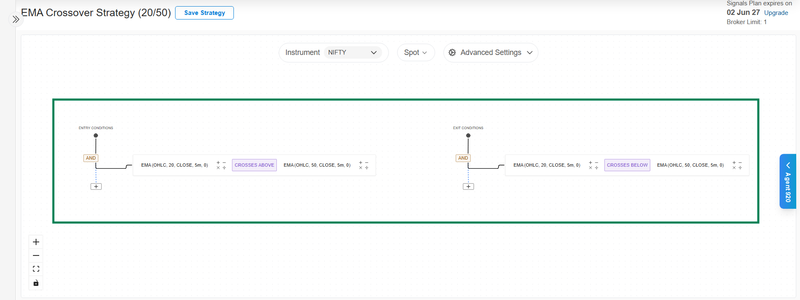
Read the documentation for a step-by-step walkthrough.
Step 5: Backtest the Strategy
Do not go live before you backtest. This is the step that tells you whether the strategy holds up on real data.
Run the backtest on at least 12 months of historical data. Look at how the strategy performs across different market conditions, strong trending periods, choppy sideways phases, and high-volatility events like RBI announcements or Budget day. EMA crossover strategies tend to perform well in trending markets and give back gains during ranging ones. Your backtest will show you exactly where that happens.
Look at these numbers specifically.
Win rate: EMA crossover strategies do not need a high win rate. What matters is whether winning trades are significantly larger than losing ones.
Profit factor: A profit factor above 1.5 is a reasonable starting benchmark. Below 1 means the strategy is losing money overall.
Maximum drawdown: How far does the equity curve fall before recovering? If the drawdown is uncomfortable, you will abandon the strategy at the worst moment.
Performance in flat markets: This is where EMA indicator strategies typically struggle. If results improve significantly when you filter out low-volatility periods, add a trend-strength filter. ADX is the most practical one to test here. If you set a condition that requires ADX to be above 25 before any EMA crossover signal fires, you filter out most of the false signals in ranging conditions. See this guide on how to automate an ADX indicator strategy for the exact setup.
Related Read How to Backtest Rolling Straddles with Indicators
Step 6: Run a Forward Test First
Before committing real capital, run the strategy in forward testing mode for two to four weeks. This shows you how the EMA crossover performs in live market conditions, not just historical data.
Watch for signal frequency. If you are seeing far more or fewer signals than the backtest suggested, review your conditions. Also, check for slippage on your chosen instrument. Liquid instruments like Nifty keep slippage low, which is why they are a good starting point for EMA-based automation.
Check out the best Paper trading apps for Indicator algo strategies
Step 7: Deploy and Automate Live
Once your forward test holds up, deploy the strategy live. AlgoTest connects to your broker directly. When EMA(20) crosses above EMA(50) on the 5-minute chart, the platform fires the order automatically. When EMA(20) crosses below EMA(50), it exits.
You can monitor everything from your dashboard, adjust settings, run multiple signals across different instruments, or pause the strategy at any time.
This is what algorithmic trading in India looks like when done systematically. Clear rules, tested on real data, executed without emotion.
Common EMA Indicator Mistakes to Avoid
Using the EMA indicator alone in choppy markets. EMA crossovers generate false signals when the market is ranging. The 20 and 50 EMAs will keep crossing back and forth without any real trend behind the move. Consider adding a trend filter like ADX to confirm the trend is strong before a signal fires. For a full walkthrough on setting up ADX as a filter, see this guide on how to automate an ADX indicator strategy in India.
Changing the period settings too often. It is tempting to keep optimising after every losing trade. Stick with 20 and 50 for a meaningful backtest period before making changes. Frequent adjustments introduce overfitting and the EMA indicator strategy stops working in live conditions.
Ignoring the timeframe. EMA(20) and EMA(50) on a 5-minute chart behave very differently from the same settings on a 1-hour chart. Be specific about your timeframe and backtest that exact combination before going live.
Skipping the forward test. A backtest tells you how the strategy performed historically. A forward test tells you how it behaves now. Both matter. Do not skip the forward test just because your backtest looks good.
Start Automating Your EMA Indicator Strategy
If you are ready to stop watching two lines on a chart manually and start running a system that acts for you, Signals AI on AlgoTest is where to build it. Set up your EMA indicator conditions, backtest them on real Indian market data, and deploy live without writing a single line of code.
Related Reads:
10 Best TradingView Alternatives