A bearish candle forms when an asset closes below its opening price during a selected timeframe. It shows that price finished the period lower, but it does not automatically mean the next candle will fall.
For traders, the useful question is what happens around that candle: did it appear after a rally, near resistance, or during an existing decline? And can the setup be turned into rules that hold up when tested?
This guide covers eight bearish candlestick patterns, real Nifty and BankNifty examples, and a structured way to define your market, timeframe, pattern, context, entry, exit and exposure before testing on AlgoTest.
What Is a Bearish Candle?
A bearish candlestick usually appears red or black, depending on your chart settings. Its body represents the distance between the opening and closing prices, while its wicks show the period’s highest and lowest prices.
The body shows the net open-to-close movement. The upper wick records how far price travelled above the body, while the lower wick shows how far it travelled below it.
Candle colour describes the relationship between the open and close. It does not necessarily tell you whether the asset closed below the previous session’s close.
8 Bearish Candlestick Patterns to Know

A bearish candle closes below its open. A bearish candlestick pattern uses one or more candles and their position within a trend to suggest possible weakness.
Some bearish reversal patterns can include green candles. This is a focused selection of single-, two- and three-candle formations, not an exhaustive catalogue. Most are reversal setups; marubozu can also appear during an existing decline.
1. Bearish Engulfing
After a price rise, a bullish candle is followed by a bearish candle whose body completely covers the first candle’s body. The wicks do not need to be engulfed.
What to check: Decide whether your entry requires a later break below the pattern’s low. That is an additional confirmation rule, not part of the basic pattern definition.
2. Shooting Star
A shooting star appears after an advance. It has a small body near the bottom of its range, a long upper wick and little or no lower wick. The upper wick is commonly at least twice the body’s length.
The shape shows that price moved higher but could not hold those levels. Its body may be red or green.
What to check: Look for subsequent weakness instead of assuming the upper wick confirms a reversal. A similar shape after a decline is called an inverted hammer and has a different interpretation.
3. Evening Star
An evening star develops after an uptrend across three candles: a substantial bullish candle, a small-bodied candle showing hesitation, and a bearish candle closing well into the first candle’s body.
In the classic formation, gaps separate the middle candle’s body from its neighbours. If you relax gap requirements for intraday testing, document that variation.
What to check: Wait until the third candle closes before classifying the completed pattern. A small candle after a rally is not enough by itself.
4. Hanging Man
A hanging man forms after an uptrend. Its small body sits near the high, with a long lower wick and little upper wick. The lower wick is commonly at least twice the body’s length.
It shows that substantial selling occurred during the period, although price recovered before the close. Both red and green bodies can qualify.
What to check: The preceding trend matters. The same shape after a downtrend is a hammer. Further weakness helps establish whether the hanging man was a useful warning.
5. Dark Cloud Cover
Dark cloud cover appears after an advance. A bullish candle is followed by a bearish candle that, in the classic definition, opens above the first (green) candle’s high and closes below the midpoint of the green candle’s body, but above the green candle’s opening price.
What to check: Full body coverage would instead point to bearish engulfing. Specify which formation your rules accept.
6. Bearish Harami
A bearish harami forms after a rise when a large bullish body is followed by a smaller bearish body contained within it. This is the opposite size relationship to bearish engulfing.
The pattern suggests that the advance has paused, but the smaller candle does not establish a downtrend on its own.
What to check: Define body containment precisely. Comparing bodies is different from requiring the entire second candle, including its wicks, to sit inside the first candle’s range.
7. Three Black Crows
Three black crows consists of three substantial bearish candles with progressively lower closes after an advance. In the classic form, the second and third open within the previous body, and each candle closes near its low.
The sequence shows repeated selling pressure across several periods.
What to check: Measure how far price has already fallen. By the third candle, an entry may be far from a reasonable invalidation level or close to support. A striking pattern does not automatically offer a workable trade.
8. Bearish Marubozu
A bearish marubozu has a long bearish body with no, or very small, wicks. In the textbook formation, the open equals the high and the close equals the low.
It shows a substantial open-to-close decline and may appear during an existing downtrend or as a new burst of selling pressure.
What to check: Define “long body” relative to recent candles, and decide how much wick your rules allow. Avoid changing those thresholds to fit selected examples.
Broader bearish patterns, such as descending triangles and head-and-shoulders formations, describe larger chart structures rather than these individual candlestick formations.
Real Nifty and BankNifty Bearish Candle Examples
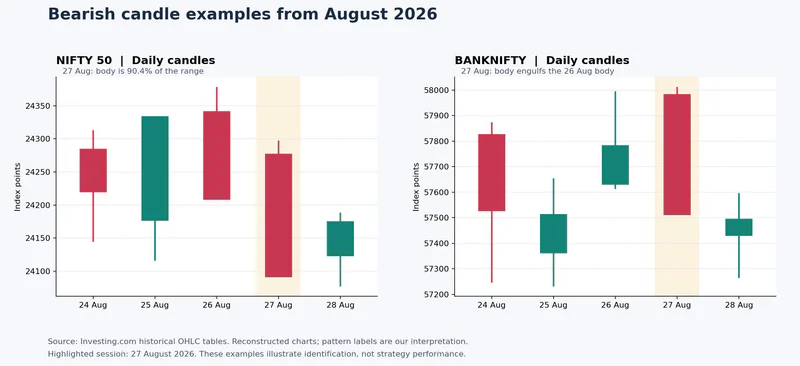
These reconstructed daily charts use published OHLC data. The pattern classifications below are our interpretation of that data, not claims of proven profitability.
Nifty: A Marubozu-Style Candle on 27 August 2026
The body measured 186.75 points out of a 206.60-point range, or 90.4%. The close equalled the low, but there was a 19.85-point upper wick.
This meets an illustrative rule of “bearish body at least 90% of the range.” It is not a textbook wickless marubozu. A stricter 95% threshold would reject it, showing why exact definitions matter. Data: Nifty historical prices.
BankNifty: Bearish Engulfing on 26-27 August 2026
After a short rise, the second candle opened above the first close and closed below its open, fully engulfing the bullish body.
The completed pattern’s low was 57,509.95 and high was 58,012.40. Those levels become available for a subsequent entry or invalidation rule only after the pattern closes. This two-candle example does not establish a durable trend reversal. Data: BankNifty historical prices.
How to Turn a Bearish Candle Into Trading Rules
“Enter when the chart looks bearish” leaves too much open to interpretation. A testable strategy needs precise conditions.
The following specification uses bearish engulfing to show how each decision becomes measurable. These are illustrative starting rules, not a tested recommendation or a claim that every condition is available as a preset.
Reject new entries at or after 15:00 IST, and skip if the executable underlying entry reference is already at or above invalidation. Keep these timing and sizing assumptions fixed while evaluating the setup.
The signal study and the traded position need separate results. You cannot short the spot index directly. For a long-put test, also specify strike selection, expiry selection, lot size, transaction costs and exit execution. An index move of 100 points does not translate into a 100-point option gain.
When both stop and target fall inside one historical candle, use finer data to establish the order or apply a disclosed conservative assumption. Do not automatically count the target first.
For help choosing the candle interval, read AlgoTest’s guide to timeframes for intraday trading. For sizing and exit planning, see trading risk management.
Test Whether a Filter Adds Value
Start with the defined pattern rules, then test one additional filter at a time. For example, compare the baseline against a version that also requires the confirmation candle to close below the 20-period EMA.
AlgoTest’s guide to indicators for options trading explains tools such as RSI, moving averages and MACD. Use them to form testable conditions; their presence alone does not validate a setup.
Compare trade count, average profit or loss after costs, maximum drawdown and losing streaks. Then evaluate the rules on a separate period that was not used to select the filter. Fewer trades or a higher win rate do not necessarily mean a better strategy.
Have a candle-based trading idea? Start testing for free on AlgoTest.
How AlgoTest Fits Into Your Strategy Testing
Once the rules are clear, the next step is checking whether the implementation behaves as intended.
AlgoTest Signals AI lets you describe a strategy in plain language or build conditions visually. It supports chart previews, backtesting, forward testing and live deployment for supported instruments.
1. Specify the conditions
Bring the seven-part specification above into the builder: instrument, timeframe, candle relationships, context, entry, exit and exposure. For a custom pattern, explain the actual conditions instead of relying only on a name such as “bearish engulfing.”
Check that the available builder inputs can express every condition in your definition. Review the generated logic before proceeding. AlgoTest’s Creating Signals guide covers entry and exit conditions, chart selection and signal limits.
2. Check the chart and trade results
Use the chart preview to inspect where entries and exits appear. Look at both expected triggers and cases where the strategy correctly stayed out.
Connect the intended trade and review the historical results. AlgoTest’s strategy validation workflow includes entry and exit logs, backtesting, drawdown and trade-level records.
When assessing the results, ask:
Is the strategy profitable after realistic trading costs and slippage assumptions?
Does it depend on a few unusually profitable trades?
How long and deep are losing periods?
Does it behave reasonably on a separate period that was not used to adjust the rules?
3. Forward test before deployment
Run the strategy through Forward Test to observe its behaviour as new market data arrives. Compare the signals with your written rules and review any unexpected activity.
Paper trading helps check the workflow, but simulated fills cannot establish the execution quality you will receive in live trading.
If you already maintain the pattern logic on TradingView, AlgoTest Signals offers an alternative route for connecting alerts to trade execution. Verify the complete alert-to-order setup before relying on it.
Common Mistakes When Using Bearish Candlestick Patterns
Acting before the candle closes: A developing pattern can disappear before the period ends.
Ignoring the trend: Similar candle shapes can have different meanings after an advance and a decline.
Assuming indicators guarantee confirmation: Additional filters need testing; adding more does not automatically improve results.
Judging only by win rate: Average wins, losses, costs and position size determine profitability together.
Expecting guaranteed option profits: A bearish underlying move is only one factor affecting option premiums.
Build a Tested Strategy From the Pattern
A bearish candle is a useful observation. To turn it into a trading strategy, define the context, entry, exit and position risk, then evaluate the complete setup across historical and live market conditions.
AlgoTest helps you move from an idea to a strategy you can inspect and test before deciding whether to deploy.
Join us as we simplify algo trading in India.