FII DII data shows the daily buying, selling and net activity of foreign and domestic institutional investors in India’s cash market. The headline figures published by exchanges are provisional, meaning they can change after reporting updates.
For traders, FII and DII data provides context about institutional activity. It does not reveal which stocks every institution traded, why it traded them, or what the market will do next.
Let's see where to find the figures, how to read them and how to avoid drawing conclusions that the data cannot support.
What Is FII DII Data?
FII stands for Foreign Institutional Investor. The term commonly refers to overseas institutions such as investment funds, pension funds and asset managers investing in Indian securities.
DII stands for Domestic Institutional Investor. These include Indian institutions such as mutual funds, insurance companies, banks and pension funds.
You will also see the term FPI, or Foreign Portfolio Investor. FPI is the broader regulatory category that replaced the earlier FII framework. In market commentary, “FII activity” remains a common shorthand for foreign portfolio activity, although the terms are not identical in scope.
The daily cash-market report shows each group’s gross purchases, gross sales and net value. It measures trading activity during the session, not the total value of their holdings.
Where to Check FII DII Data Today
For the latest figures, start with the NSE FII/FPI and DII trading activity report.
The page provides both NSE-only activity and consolidated activity across NSE, BSE and MSEI. Select the consolidated table when you want the broader exchange figure, and check its reporting date before using the numbers.
There are two main reporting sources to distinguish:
The exchange figures are generally available after the trading session and can be revised. Depository reports have their own reporting basis and timing, so they should not be treated as a simple next-day replacement for the entire exchange table.
How to Read FII DII Data: Step-by-Step for Beginners
Three numbers matter:
Gross purchases: The total value bought by the group.
Gross sales: The total value sold by the group.
Net value: Purchases minus sales.
The calculation is straightforward:
Net value = gross purchases − gross sales
A positive result means the group bought more than it sold. A negative result means it sold more than it bought.
Here is an illustrative example, with all figures in ₹ crore:
FIIs were net sellers of ₹3,200 crore, while DIIs were net buyers of ₹3,600 crore.
Domestic net buying exceeded foreign net selling in this example. However, that does not establish that the index rose or remained flat. The groups may have traded different stocks at different times, and other market participants also influenced prices.
Do not ignore the gross figures. Large purchases and sales alongside a small net value indicate substantial two-way activity. They do not necessarily mean the same institutions repeatedly bought and sold the same positions.
Turn Market Context Into Testable Rules
FII DII data helps you understand institutional activity. With AlgoTest, you can backtest supported price, indicator and options-based trading rules before risking capital.
Why FII and DII Activity Matters for Traders
Institutional orders can influence prices, particularly when substantial buying or selling continues across several sessions.
Foreign portfolio activity can reflect global interest rates, changes in the rupee, relative valuations and decisions about how much capital to allocate to India. Domestic institutional activity can reflect contributions, redemptions and portfolio adjustments.
Regular SIP contributions are one source of money for domestic mutual funds. However, SIP collections are not the same as net equity purchases: redemptions, scheme mandates and deployment decisions also matter.
FII DII data therefore helps answer a limited but useful question:
Were these institutional groups net buyers or net sellers during the period?
It cannot, by itself, explain their motives or predict the next session.
How to Read FII and DII Activity Together
Looking at both groups gives more context than focusing only on foreign selling or domestic buying.
These are descriptions of activity, not automatic bullish or bearish signals.
A practical way to review the data is to:
Check the reporting date and source.
Read gross purchases, gross sales and net values.
Compare the latest session with a consistent recent window, such as five or ten trading sessions.
Review how the index and relevant sectors behaved over that period.
Examine derivatives positioning separately.
For example, daily FII net values of −₹1,000 crore, +₹500 crore and −₹1,500 crore produce a three-session cumulative net sale of ₹2,000 crore.
That is more informative than describing only the second day as foreign buying. However, there is no universally correct lookback period, and a cumulative trend is still not a trade recommendation.
How Options Traders Use FII DII and F&O Data
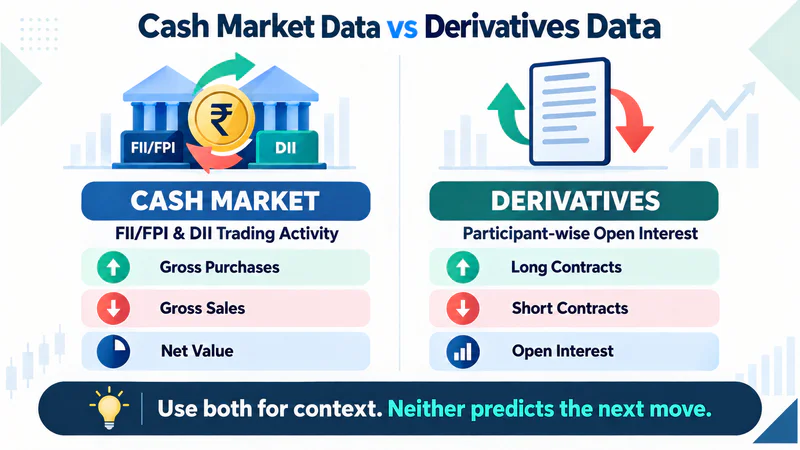
The headline FII DII table covers cash-market activity only. It does not include futures and options positions.
Institutions can hold shares while using derivatives to hedge or manage risk. So cash buying alongside short futures positions does not mean the data contradicts itself.
For F&O positions, options traders use NSE’s participant-wise open interest report. It splits outstanding F&O positions into four groups (FII, DII, Client and Pro), and shows their long and short contracts in:
index futures,
index call and put options,
stock futures and options.
These are contract counts, not the rupee values you see in the cash-market table.
What options traders usually check:
FII positions in index futures. Compare FII long and short contracts to see whether foreign institutions are net long or net short on the index.
FII positions in index options. Look at how many index calls and puts FIIs are long or short, to understand how they may be positioned or hedged.
Day-to-day changes. A shift in positions over several sessions tells you more than a single day’s numbers.
Cash and F&O together. For example, FII cash selling alongside rising FII short positions in index futures points to a more bearish setup than cash selling alone.
Read our guide to participant-wise open interest for a full walkthrough of this report.
If the terminology is new, start with the basics of open interest. Our guide to OI spurts covers a separate tool that tracks sudden changes in open interest. It does not replace participant-wise data.
Neither report reveals an institution’s full strategy. Combining cash activity and F&O positioning gives you more context, but it cannot prove whether a position is a hedge or a directional bet.
Why NSE and NSDL FII Data Don’t Match
A news headline may report foreign inflows while the exchange table shows net selling. Before assuming one is wrong, check what each figure measures.
The exchange report covers provisional cash-market trading activity. NSDL’s FPI reports distinguish between investment routes, including stock-exchange transactions and primary-market or other activity.
The latter can include transactions such as primary-market purchases, preferential allotments and rights issues. These do not all appear as purchases in the exchange’s daily trading table. NSDL explains the included transaction types in its reporting notes.
Reporting dates and custodian confirmations can also differ.
When comparing two figures, match:
The period being measured.
The asset class, such as equity rather than total equity and debt.
The investment route.
The provisional or confirmed reporting basis.
This avoids comparing two valid numbers that answer different questions.
What FII DII Data Cannot Tell You
The headline report has several limits:
Individual stock choices: Aggregate net buying does not identify every stock bought or sold.
Trading motives: The figures do not explain whether activity reflects valuation decisions, redemptions, hedging or portfolio adjustments.
Complete market participation: The table does not separately describe all other investor groups.
Next-day direction: Net institutional buying does not guarantee a rising market, and net selling does not guarantee a decline.
Reasons for unusually large trades: Index rebalancing activity can be included in the totals without being separately identified.
For Nifty traders, another distinction matters: consolidated FII DII cash-market data is not a Nifty-only flow report.
It can provide background for index analysis, but it should not be presented as the exact amount institutions bought or sold in Nifty constituents.
Common Mistakes When Reading FII DII Data
The most common error is turning a descriptive number into a trading instruction.
“FIIs sold today, so the market must fall tomorrow” skips the effects of prices, expectations, other participants and overnight developments.
Other mistakes include comparing different reporting dates, treating provisional values as final, and assuming all domestic buying directly offsets foreign selling.
Keep the same source and measurement method when tracking a trend. If you change datasets halfway through, the apparent change may reflect reporting differences rather than investor behaviour.
The same discipline applies when designing a strategy: define what you are measuring before deciding how to act on it. Our guide to common algo trading mistakes covers related testing and execution pitfalls.
How to Use FII DII Data in Your Trading Strategy
An institutional-flow observation is not yet a strategy. A testable approach needs a defined entry, exit, risk limit and decision time.
You might use FII DII activity as context while reviewing price behaviour, Nifty open interest or the Nifty option chain. But testing a flow-based condition requires historical flow data and a backtesting workflow that supports that input.
Testing price or options rules alone does not validate the additional FII/DII filter.
Timing matters too. If a day’s institutional figures become available only after the close, they cannot legitimately trigger a trade earlier that same day in a historical test. That would introduce look-ahead bias: using information that was not yet available.
For strategy rules supported by AlgoTest, backtesting can help evaluate historical performance. Use appropriate cost and slippage assumptions, then consider forward testing (aka paper trading) to observe the strategy in current conditions.
Want to see how options behaved on days of heavy FII selling? Replay that session in the AlgoTest Option Simulator and watch how Nifty premiums moved minute by minute, without risking money.
Read 'how backtesting and forward testing work on AlgoTest'
Build a Tested Strategy Around FII DII Context
FII DII data is useful context, not a complete market forecast. Read purchases, sales and net values together, compare a consistent period and distinguish cash-market activity from derivatives positioning.
Most importantly, separate what the report shows from what you infer. A net selling figure is evidence of selling, not proof of the reason behind it or the market’s next move.
When you are ready to evaluate a rules-based options strategy, use AlgoTest to backtest the conditions its tools support and review simulated performance before considering live deployment. AlgoTest offers 25 free backtests each Monday.
FAQs
What is FII DII data?
FII DII data shows how much foreign and domestic institutional investors bought and sold in India’s cash market on a given day. Each group’s figures include gross purchases, gross sales and the net value.
Where can I check FII DII data for today?
NSE publishes the FII/FPI and DII trading activity report on its website after each trading session. Choose the consolidated table to see activity across NSE, BSE and MSEI, and check the report date before using the numbers.
Is FII DII data released every day?
Yes. Exchanges publish provisional FII and DII figures after every trading session. Because they are provisional, the numbers can be revised later.
What does FII selling mean for the market?
FII selling means foreign institutions sold more shares than they bought that day. It can add pressure on prices, especially over several sessions, but it does not guarantee the market will fall.
Is FII buying good for the market?
Steady FII buying often supports prices because it brings fresh money into Indian stocks. Treat it as background context, though, since prices also depend on other investors, news and global markets.
What is the difference between FII and FPI?
FPI, or Foreign Portfolio Investor, is the official SEBI category that replaced the older FII framework. In everyday market talk, “FII” is still used as shorthand for foreign portfolio activity.
How do options traders use FII DII data?
Options traders use FII DII cash data as background, and check NSE’s participant-wise open interest report for FII positions in index futures and options. Looking at both together gives a fuller picture of institutional positioning.
This article is for educational purposes only and is not investment advice.