The FINNIFTY live chart helps you track how India’s financial services sector is moving during the trading day. Use it to study trends, support, resistance, and momentum shifts.
If you trade FINNIFTY options, combine the index chart with the option chain and option-premium charts. This gives you information about price direction, open interest, volume, liquidity and option premiums.
This guide explains how to use these tools together without making your analysis unnecessarily complex.
Access Free FINNIFTY Charts and Options Data
You can access the following FINNIFTY tools on AlgoTest:
What Is FINNIFTY?
FINNIFTY is the trading symbol commonly used for the Nifty Financial Services Index.
The index tracks companies from different areas of India’s financial services industry, including:
Banks
Financial institutions
Housing finance companies
Insurance companies
Non-banking financial companies
Other financial services businesses
FINNIFTY is different from Bank Nifty. Bank Nifty focuses on banks, while FINNIFTY covers the broader financial services sector.
Companies and their weights can change during index reviews. Check the latest composition through the official Nifty Financial Services page instead of relying on an old list.
How to Read the FINNIFTY Live Chart
Start with price behaviour before adding technical indicators.
1. Select a Suitable Timeframe
Your timeframe should match how you trade:
1-minute and 5-minute charts: Short intraday setups
15-minute charts: Main intraday trend and structure
Hourly charts: Positional setups and stronger price levels
Daily charts: Broader market direction
You can use two timeframes together. For example, identify the trend on a 15-minute chart and refine your entry on a 5-minute chart.
2. Identify the Price Structure
Study the sequence of highs and lows:
Higher highs and higher lows can indicate an uptrend.
Lower highs and lower lows can indicate a downtrend.
Repeated movement inside a fixed zone can indicate a sideways market.
Do not treat one large candle as a confirmed change in trend. Check whether price sustains above or below the important level.
3. Mark Support and Resistance Zones
Support is an area where buying interest has appeared before. Resistance is an area where selling pressure has increased.
Mark zones instead of exact prices. FINNIFTY may briefly cross a level before moving back into its previous range.
Previous highs, lows, gaps and consolidation areas can help you find these zones.
4. Use Limited Technical Indicators
Indicators should support your price analysis, not replace it.
You can use:
Moving averages for trend direction
RSI for momentum
MACD for momentum shifts
Bollinger Bands for volatility
ATR for estimating price movement
Avoid using several indicators that provide the same signal. Our guide to the best indicators for intraday trading explains when each indicator is useful.
5. Do Not Use Spot Index Volume
FINNIFTY is an index, not a directly traded security. Therefore, its spot chart does not have its own traded volume like a share or futures contract.
To study market participation, check FINNIFTY futures volume or options volume separately.
How to Combine the FINNIFTY Chart With Options Data
The index chart shows the direction of the underlying index. An options chart shows how the premium of a selected call or put has moved.
The FINNIFTY option chain helps you compare contracts across strike prices. Important fields include:
Last traded price
Open interest
Change in open interest
Volume
Bid and ask prices
Implied volatility
Open interest tells you how many contracts remain open, while volume shows how many contracts traded during the session. Read our guides to OI in options trading and volume in an option chain for a detailed explanation.
You can use OI concentrations to identify strikes with high participation. However, high OI does not guarantee support or resistance. Positions can be closed or shifted quickly.
Our option chain analysis guide explains how to combine OI with option prices, PCR and other data.
Does FINNIFTY Have Weekly Expiry?
No. NSE discontinued weekly FINNIFTY options after the final weekly expiry on 19 November 2024.
FINNIFTY currently has three consecutive monthly contracts:
Near month
Mid month
Far month
These contracts expire on the last Tuesday of the expiry month. If Tuesday is a trading holiday, the contract expires on the previous trading day.
You can read our updated guide to FINNIFTY expiry dates and timings for more details.
NSE confirms the monthly cycle and Tuesday expiry in its FINNIFTY contract specifications.
What Moves FINNIFTY Today?
FINNIFTY can react to developments affecting the financial sector, including:
RBI policy and interest-rate decisions
Changes in bond yields
Bank and financial-company earnings
Credit growth and asset-quality data
Insurance and housing-finance developments
Regulatory announcements
Global market sentiment
Large movements in heavily weighted stocks
Check whether a major economic announcement or company result is due before entering a trade. Unexpected news can quickly invalidate a technical setup.
During the Closing Auction Session, the indicative closing price may also differ from the last traded price. Read how to track the indicative closing price during CAS when analysing movements near the market close.
A Practical FINNIFTY Analysis Workflow
Follow this process before taking a FINNIFTY options trade:
Check the broader trend: Use an hourly or daily chart to identify the main direction.
Mark key levels: Note the previous session’s high, low, close and major price zones.
Study the intraday structure: Use a 5-minute or 15-minute chart to identify the current trend or range.
Choose the correct expiry: FINNIFTY has monthly expiries, not weekly expiries.
Check the option chain: Compare OI, volume, LTP and implied volatility near the at-the-money strike.
Review liquidity: Avoid contracts with low volume or wide bid-ask spreads.
Open the option-premium chart: Confirm how the selected call or put is moving.
Define the trade: Set the entry, stop-loss, target and maximum acceptable loss before placing the order.
Test the rules: Use historical data to see how the setup performed in trending, sideways and volatile markets.
Our guide on how to backtest options strategies explains what to test and how to review the results.
Include brokerage and realistic execution costs. The difference between the expected and executed price is called slippage, and ignoring it can make a strategy appear more profitable than it is.
After backtesting, you can use paper trading to observe the strategy with live market data before risking real capital.
Common FINNIFTY Analysis Mistakes
Avoid these common mistakes:
Looking for a weekly FINNIFTY expiry
Using too many technical indicators
Treating high OI as guaranteed support or resistance
Ignoring bid-ask spreads and liquidity
Confusing the spot index chart with an option-premium chart
Selecting a strategy based on one chart example
Ignoring brokerage, slippage and other trading costs
Use FINNIFTY Charts to Validate Your Trading Setup
The FINNIFTY live chart helps you understand the direction and price structure of the Nifty Financial Services Index. If you trade its options, combine the chart with OI, volume, liquidity and option-premium data before selecting a contract.
You can follow the same process when analysing other indices. For example, if you trade BSE Sensex options, the live Sensex option chain lets you compare call and put data across strikes and expiries.
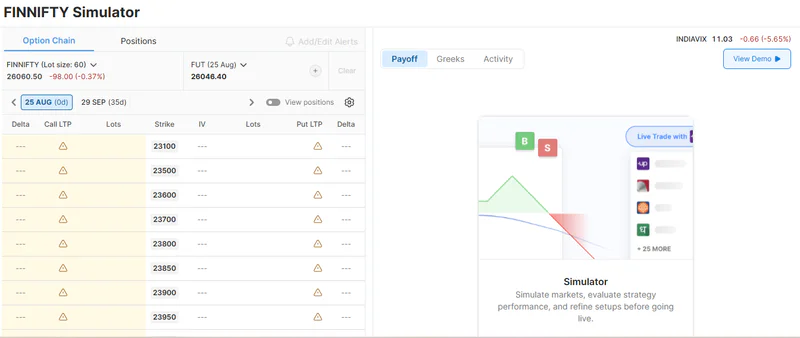
Once you have clear entry, exit and risk-management rules, use the FINNIFTY simulator to test your strategy on historical data before using real capital.