How to Analyze Trading Signals on Charts Before Automating Them
You’ve built your trading signal. The logic looks solid.
But many traders jump straight to backtesting without checking how the signal actually behaves on a real chart.
Because conditions alone don’t tell the full story.
An EMA crossover in a sideways market is very different from the same crossover at the start of a strong trend. The logic may be identical, but the context isn’t.
That’s where Signals AI helps. With Chart Preview and Entry Exit Logs, you can see exactly where your signals triggered, how the strategy behaved, and whether the logic is working as intended, before you backtest or risk capital.
View Entry and Exit Signals Directly on Charts
Once your conditions are set in Signals AI, go to the Chart Preview section.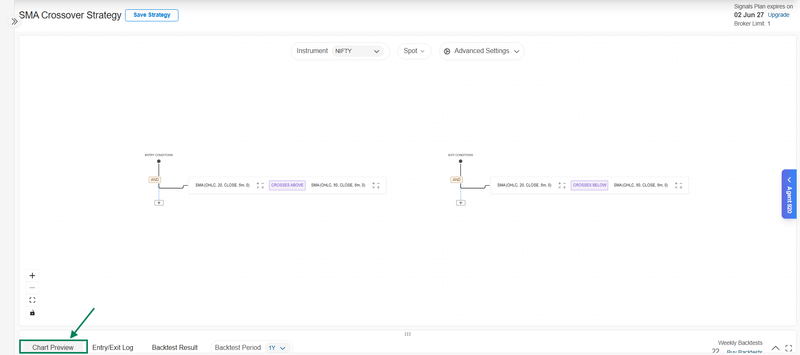
Here, you can see the price movement of your selected instrument with your entry and exit signals marked directly on the chart.
What you can view:
Entry signals: Exact points where your strategy generated a buy or sell signal
Exit signals: Where trades closed due to a stop loss, target, or exit condition
Price action context: See how the market was moving around each signal to judge whether the entry made sense
If a signal fires during a sharp downtrend when your strategy was meant to capture upward momentum, you’ll spot it instantly, without digging through raw data.
You can also expand the chart for a detailed view or minimize it while refining your strategy on the canvas.
Analyze Trading Signals Across Multiple Timeframes
The same strategy behaves differently depending on the timeframe.
Chart Preview lets you switch between them with one click, without rebuilding the strategy.
Here is how each timeframe changes signal behavior:
1-minute chart: high-frequency signals, useful for scalpers, but prone to noise in choppy sessions
5-minute or 15-minute chart: fewer signals, better quality for most intraday traders, cleaner trend context
1-hour or daily chart: signals fire less often, each one carries more weight, better suited for swing traders
Switch timeframes in Chart Preview and see how the same indicator logic behaves across each interval. Decide which timeframe fits your trading style before you commit to a backtest.
Overlay Technical Indicators for Better Signal Context
Chart Preview lets you add technical indicators directly on top of your signal chart.
This is where you validate that your conditions are actually producing signals at the right moment. You are not checking indicators separately from your buy and sell signals. You see both together on one chart.
How traders use indicator overlays:
EMA Overlay
Confirm that the signal marker lines up with the actual EMA crossover point. If it fires one or two candles late, the condition needs adjusting.
RSI Overlay
Check whether entry signals trigger when RSI is in a favorable zone or already overbought or oversold.
MACD Overlay
See whether the MACD histogram confirms the direction at the time of entry.
VWAP Overlay
Check if intraday entries are happening above or below the volume-weighted average price.
If you are using AlgoTest as a TradingView alternative for signal building and verification, this is the equivalent of running your indicator analysis and signal check in the same window instead of switching between tools.
Track Exact Entry and Exit Signals with Timestamps
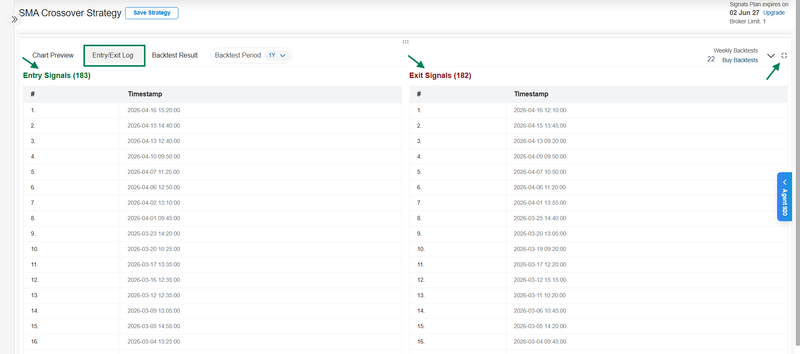
The Entry and Exit Logs record every signal trigger your strategy generates, with the exact date and time of each event.
What the logs show:
Entry Log: every timestamp where your strategy generated an entry signal, each row is one trade initiation
Exit Log: every timestamp where the strategy closed a trade and the reason, stop loss, target, or exit condition
Timestamps: exact date and time of every trigger so you can cross-reference each signal with what the market was doing at that moment
This is a key difference from algo platforms that only send you a signal alert. An alert tells you a condition fired. The log tells you when it fired, how often it fired, and whether the pattern is consistent across different market sessions.
A strategy that generates 35 entry signals in one session is a very different system from one that generates 4. The log shows you this before you run a single backtest.
Related: Learn how to create trading Signals on AI
Spot False Triggers and Strategy Issues Faster
Chart Preview and the logs together expose the most common signal problems before they cost you anything.
Common issues you can catch and fix:
Too many signals: your conditions are too loose for the selected timeframe. Visible immediately in the log as signal clusters during flat sessions.
Delayed entries: the signal fires two or three candles after the actual indicator crossover. Visible on the chart when the marker appears well after the move has started.
Wrong exits: the exit condition closes the trade too early. Visible on the chart when the exit marker is followed by continued price movement in your intended direction.
Noisy triggers: signals fire during sideways price action where no real trend exists. Visible when you overlay a trend indicator like EMA or VWAP and see signals firing against the trend direction.
Each of these can be fixed on the canvas. Adjust the condition, go back to Chart Preview, and check again. The iteration loop is fast.
Read the Signals AI documentation for a complete breakdown of every feature.
Analyze, Refine, Then Backtest and Deploy
Signals Visualization is not the final step. It is the step that makes every step after it more reliable.
The workflow:
Analyze your trading signals on the chart
Check the entry and exit log for frequency and consistency
Identify issues and refine conditions on the canvas
Preview again until the chart and log both look right
Move to backtest with a strategy you have already validated visually
Forward test, then deploy live to your broker through AlgoTest
No external tools. No TradingView subscription. No webhook setup. Everything from signal creation to live execution runs inside one platform.
The full workflow is covered in the Signals AI overview blog.
Join us as we simplify algo trading in India for retail traders.