The MCX option chain, also called the commodity option chain, is a table showing all call and put options for a commodity, like crude oil, gold, silver or natural gas, for one expiry. For each strike price, it shows the premium, open interest (OI), change in OI, volume and implied volatility (IV), so you can see where traders are positioned.
You can open the MCX option chain in AlgoTest’s Strategy Builder, available on AlgoTest plans.
Quick answer: how to read the MCX option chain:
Pick the commodity, contract size and expiry.
Find the at-the-money (ATM) strike using the futures price, not the spot price.
Read call and put OI to find likely resistance and support.
Check change in OI to see whether positions are being added or closed.
Check volume, the bid-ask spread and IV before you trade a strike.
Use the put-call ratio (PCR) and max pain as extra context, not as signals on their own.
Read the chain, then test your idea on past data before you trade it. Sign up to get 100 Backtests free/month
What Is MCX Option Chain?
MCX lists options on Crude Oil, Natural Gas, Gold, Silver, Copper and Zinc, plus mini versions of crude oil, natural gas, gold and silver. The option chain puts every strike for one contract and expiry on a single screen.
MCX options are European-style options on futures, so they can only be exercised at expiry, and the underlying is a futures contract, not the physical commodity.
MCX Option Chain Layout and Data
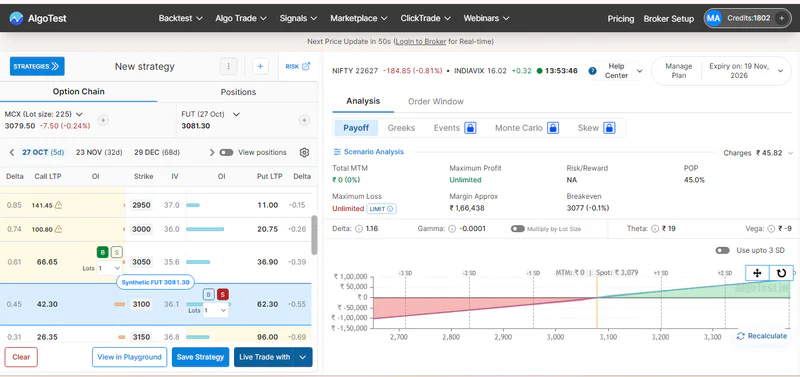
Strike prices run down the middle, calls are on the left and puts are on the right. Most option chains shade in-the-money (ITM) strikes, so you can tell them apart from out-of-the-money (OTM) strikes at a glance.
[Screenshot: AlgoTest MCX option chain for crude oil. Alt text: MCX option chain on AlgoTest showing crude oil calls and puts]
Some option chains also show Greeks like delta and theta. Our guide to option Greeks explains each one.
Open the MCX option chain in AlgoTest for crude oil, natural gas, gold and silver, available on AlgoTest plans.
MCX Options vs Nifty and Sensex Options
If you already read the Sensex option chain or Nifty option chain, these are the differences that matter on MCX.
MCX trading time guide covers each session in detail.
How to Read MCX Option Chain: Step by Step
Step 1: Pick the Commodity, Contract and Expiry
Start with a liquid commodity, and see our list of the best commodities to trade in India if you are unsure. Then choose a contract that fits your capital, because the lot size decides how much each price move is worth. Our MCX lot size guide lists every contract.
Most traders use the nearest expiry, as it usually has the most OI and volume. For gold and silver, options expire monthly but futures do not, so check which futures contract sits under your expiry.
Step 2: Find the ATM Strike Using the Futures Price
The ATM strike is the one closest to the underlying futures price. Strikes below it are ITM for calls, and strikes above it are ITM for puts. Our ITM, ATM and OTM guide explains these terms, and our guide to choosing the right strike price shows how to pick one.
Step 3: Read Call and Put OI
Many traders read OI from the option seller’s point of view, because sellers carry bigger risk and need much larger margins than buyers.
The call strike with the highest OI often acts as resistance, because sellers there expect prices to stay below it.
The put strike with the highest OI often acts as support, because sellers there expect prices to stay above it.
Step 4: Track Change in OI
Change in OI shows whether these levels are getting stronger or weaker during the day.
Our guide to OI in options trading covers more patterns.
Step 5: Check Volume, Spread and IV
High OI does not always mean a strike is easy to trade. Strikes far from the ATM, and mini contracts, often have low volume and wide bid-ask spreads. Our guide to reading volume in an option chain covers this.
IV usually rises before scheduled events and drops after them. For crude oil, watch the weekly US inventory report on Wednesdays, and for natural gas, the weekly US storage report on Thursdays. Both usually come out at 8 PM IST (9 PM after US daylight saving ends), except in holiday weeks. Our implied volatility guide explains how IV affects premiums.
Step 6: Use PCR and Max Pain as Context
The put-call ratio (PCR) is total put OI divided by total call OI. Many traders read a PCR above 1 as support building below the market and a PCR well below 1 as resistance building above it, but PCR alone does not predict direction. See our put-call ratio guide.
Max pain is the strike where option buyers as a group would lose the most at expiry. Prices do not always move towards it, so treat it as one input. Our max pain guide shows how it is calculated.
Picked your strikes from the chain? Model the position in the AlgoTest Strategy Builder to see its payoff, breakeven and maximum loss (where defined) before you place it.
MCX Option Chain Analysis: Crude Oil Example
This is an illustrative example, not live market data. Say crude oil futures are trading at ₹6,010 and the chain shows this:
The ATM strike is 6,000, because it is closest to the futures price of ₹6,010.
The highest call OI is at 6,100, so traders see resistance there.
The highest put OI is at 5,900, so traders see support there.
Together, these point to a likely range of 5,900 to 6,100 unless OI shifts.
Total put OI is lower than total call OI, so the PCR is below 1, which leans cautious.
If prices climb towards 6,100 while call OI there falls and IV rises, sellers may be exiting and a breakout becomes more likely. If call OI keeps rising instead, the 6,100 level is getting stronger.
Want to see how a crude oil chain changes around US inventory data? Replay a past MCX evening session in the AlgoTest Option Simulator and watch OI and premiums move.
How to Trade Commodity Options Using the Option Chain
When OI shows a clear range, some traders sell options outside it using defined-risk setups like an iron condor.
When OI at a key strike falls as price moves towards it, traders watch for a breakout and may buy options in that direction.
Before US inventory or storage data, IV often rises, so buying options then costs more and premiums can drop sharply after the release.
In expiry week, many traders close or roll ITM positions early, for the reasons explained in the next section.
Whichever approach you use, check the bid-ask spread and size the trade to your capital first using our guide to position sizing.
What Happens to MCX Options at Expiry
Out-of-the-money options expire worthless. In-the-money options devolve into futures positions: a long call becomes long futures, and a long put becomes short futures.
The exchange raises the margin on ITM options as expiry nears. It blocks 25% of the futures margin two days before expiry, 50% one day before and 100% on expiry day. Many brokers square off ITM positions early if you do not have enough margin.
Access Historical MCX Option Chain Data on AlgoTest
A live chain shows today’s positions. AlgoTest shows you how the same setups would have played out on historical MCX data, with one of the most detailed backtest reports available to Indian options traders.
Replay past MCX sessions in the Option Simulator to watch how OI, IV and premiums moved around events like US inventory data.
Backtest your option chain setups on historical crude oil, natural gas, gold and silver data.
Every AlgoTest backtest report shows these metrics:
See these metrics for your own MCX strategy. Sign up to get 100 Backtests free/month
Once your rules are clear, you can trade crude oil, natural gas, gold and silver options through Zerodha. To compare brokers for MCX, see our guide to commodity brokers in India.
Turn the Chain Into a Tested Plan
An option chain shows where traders are positioned today, but it does not tell you whether your trade will work. Pick your strikes from the chain, then define your entry, exit and position risk, and check how the plan holds up across calm and volatile sessions.
AlgoTest helps you move from an idea to a strategy you can inspect and test before deciding whether to deploy.
Join us as we simplify algo trading in India.
Related Reading
FAQs
How do you read the MCX option chain?
Pick the commodity and expiry, find the ATM strike using the futures price, then read call and put OI, change in OI, volume, IV and the bid-ask spread around it. Use PCR and max pain as extra context.
How should beginners use the MCX option chain?
Start with a few strikes around the ATM and focus on OI, change in OI and volume. Smaller contracts like Crude Oil Mini and Gold Mini reduce exposure per lot, and practising on past sessions helps before you trade live.
Is the commodity option chain the same as the MCX option chain?
Mostly, yes. “Commodity option chain” usually refers to the MCX option chain, because MCX has most commodity options trading in India, but NSE also lists commodity options with its own chain.
Is the MCX option chain based on the spot price or the futures price?
It is based on the futures price. MCX options are options on futures, so the ATM strike is the one closest to the underlying futures price.
Is one MCX option lot always 100 units?
No. MCX lot sizes are set in physical units and differ by contract. One Crude Oil option lot is 100 barrels, one Gold lot is 1 kg, one Silver lot is 30 kg and one Natural Gas lot is 1,250 mmBtu.
What is PCR in the MCX option chain?
PCR is total put OI divided by total call OI for an expiry. It shows whether more puts or calls are open, but it should be read with price trend and change in OI.
What is the difference between the MCX option chain and the NSE commodity option chain?
They are separate exchanges with separate contracts. MCX has far more commodity options trading, and a position on one exchange cannot be offset by a position on the other. Our commodity exchanges guide compares them.
Can I backtest MCX option strategies?
Yes. AlgoTest backtests MCX options on historical crude oil, natural gas, gold and silver data. Each report shows P&L, win rate, risk-reward ratio, maximum drawdown, streaks, Monte Carlo analysis and downloadable trade logs.
Can the MCX option chain predict price direction?
No. It shows where traders are positioned and where support and resistance may sit, but positions can change quickly, especially around US data releases.
Where can I see the live MCX option chain?
AlgoTest shows the MCX option chain for crude oil, natural gas, gold and silver inside its Strategy Builder, available on paid plans, alongside the Nifty option chain and Sensex option chain.
Editorial note: This article is for education and is not investment advice. Expiry and margin rules come from MCX and broker guidance, reviewed on 22 October 2026, and can change. Commodity options can lead to losses, and devolved futures positions can lose more than the premium paid.
Sources: