You can open a Sensex option chain and find hundreds of numbers across different strikes. The difficult part is knowing which numbers matter and what they are telling you.
Sensex OI data can help you understand where option positions are building, which strikes have significant activity, and how positioning changes as Sensex moves.
But OI is not a standalone signal. You get a clearer picture when you compare OI with price, volume, Change in OI, and Call and Put activity.
This guide explains how to read Sensex OI data and use it with the Sensex option chain.
What Is Sensex OI Data?
Sensex OI data refers to the open interest in Sensex derivative contracts.
Open interest, or OI, is the total number of derivative contracts that remain open at a given point in time. In the Sensex option chain, OI is shown separately for Calls and Puts across different strike prices and expiries.
The main data points you will see include:
Call OI
Put OI
Change in Call OI
Change in Put OI
Volume
For example, if the 82,500 Call has OI of 5 lakh contracts, it means 5 lakh contracts are currently open at that strike.
If Change in OI is positive, open interest has increased during the period. If it is negative, some existing positions have been closed.
What Does Sensex OI Tell You?
OI helps you see where traders are positioned across different strikes.
When reading Sensex OI, start with these five things:
Highest Call OI
Highest Put OI
Change in OI
OI buildup or unwinding
Volume around important strikes
For example, suppose Sensex is trading near 82,000.
If Call OI is concentrated at 82,500 and Put OI is concentrated at 81,500, both strikes become important levels to monitor.
This does not mean 82,500 will definitely act as resistance or 81,500 will definitely act as support. You need to watch how OI changes as Sensex approaches these levels.
You can also read our guide on how to choose the right strike price for options trading.
How to Read Sensex OI Data
You do not need to analyse every strike. Start with the strikes closest to the current Sensex price.
1. Check Call OI
Call OI shows the number of open Call contracts at each strike.
A strike with high Call OI can become an important level to watch. If fresh Call OI keeps building as Sensex approaches that strike, the positioning is becoming more important.
If Call OI starts falling, positions may be getting unwound.
High Call OI does not automatically mean that a level will act as resistance.
2. Check Put OI
Put OI shows the number of open Put contracts at each strike.
A strike with high Put OI can become an important level below the current Sensex price.
As with Call OI, watch whether Put OI is increasing or decreasing rather than looking only at the total OI.
3. Check Change in OI
Change in OI tells you whether open interest is increasing or decreasing.
Look for:
Rising OI at important strikes
Falling OI at important strikes
Large changes in OI during the session
OI shifting from one strike to another
A strike may have very high OI, but if that OI is being unwound, the current positioning can be very different from what the total OI suggests.
4. Compare OI With Volume
Volume tells you how many contracts have been traded. OI tells you how many contracts remain open.
They measure different things.
High volume does not automatically mean that the same number of new positions has been created. Some trades may be closing existing positions.
This is why you should compare volume and OI rather than relying on either number alone.
How to Interpret Price and OI Together
One of the simplest ways to read OI is to compare it with Sensex price movement.
These are common interpretations used by traders. They are not guaranteed signals.
For example:
Price up and OI up can indicate fresh long positions.
Price up and OI down can indicate short covering.
Price down and OI up can indicate fresh short positions.
Price down and OI down can indicate long positions being closed.
Use price action and volume to confirm what the OI movement is showing.
How to Read Sensex Call and Put OI Together
Looking at only Call OI or only Put OI can give you an incomplete picture.
Suppose Sensex is at 82,000 and you see:
High Call OI at 82,500
High Put OI at 81,500
Strong volume around both strikes
Sensex trading between the two levels
These strikes become important zones to monitor.
Now imagine Sensex moves toward 82,500 and Call OI starts falling. The earlier resistance view may need to be reassessed.
This is why you should track both the size of OI and the change in OI.
For a complete framework, read How to Analyse Sensex Option Chain.
How to Use Sensex OI Data With the Option Chain
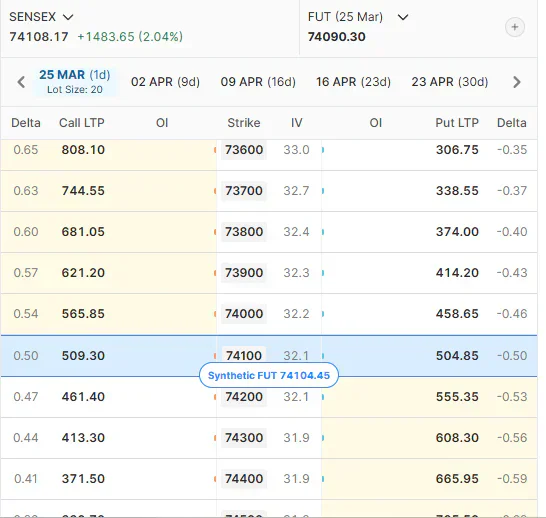
Once you understand the basic OI data, you can use it to analyse the Sensex option chain more systematically.
Follow these steps:
Check the current Sensex price.
Identify the at-the-money strike.
Find the strikes with the highest Call OI and Put OI.
Check Change in OI at those strikes.
Compare OI with price and volume.
Watch for fresh buildup or unwinding as Sensex approaches those levels.
The Sensex Option Chain lets you study these strike-wise data points together.
The goal is not to find one number that predicts the next move. The goal is to understand where positioning is concentrated and whether that positioning is changing.
Sensex OI, PCR and Max Pain
OI is often used with other options data, but these should provide context rather than standalone signals.
Sensex OI and Put Call Ratio
Put Call Ratio, or PCR, compares Put and Call activity.
Tracking PCR along with OI and price can help you understand broader positioning.
Do not use PCR alone to decide whether to buy or sell. Learn more in our guide to Put Call Ratio.
Sensex OI and Max Pain
Max pain is based on the distribution of open interest across option strikes. Traders often use it as a reference around expiry.
It should not be treated as a fixed target for Sensex. Strong market moves or large changes in positioning can make the current OI distribution less useful as an expiry reference.
Read our guide to Max Pain in Options Trading.
Common Mistakes When Reading Sensex OI
Avoid these mistakes when using OI data:
1. Treating high OI as fixed support or resistance
High OI tells you that many contracts are open. It does not guarantee that the strike will stop Sensex.
2. Looking at only one side of the chain
Compare Call and Put OI to understand where positioning is concentrated.
3. Ignoring Change in OI
Total OI can look important even when positions are being unwound. Always check how OI is changing.
4. Using OI without price and volume
OI gives you positioning data. Price and volume give you additional context.
5. Treating OI as a prediction tool
OI can help you understand positioning, but it cannot tell you exactly where Sensex will move next.
You can also read about common mistakes traders make.
Where Can You Check Sensex OI Data?
To analyse Sensex OI properly, you need strike-wise data for both Calls and Puts.
Look for:
Open interest
Change in OI
Volume
Premium
Strike price
Expiry
You can explore the Sensex Option Chain on AlgoTest to study these data points across strikes and expiries.
Once you identify a potential setup, you can take the analysis further with AlgoTest's Options Simulator. You can use historical market conditions to test how an options strategy would have behaved before risking real capital.
Analyse Sensex OI, Then Test Your Strategy
Sensex OI data helps you see where option positions are concentrated and how that positioning changes as Sensex moves.
Use OI with price, volume, and the option chain to build a clearer view of the market. Then test your trading idea instead of relying only on what the current positioning appears to show.
With Strategy Builder, you can build your setup, backtest different variations on historical data, and forward test the strategy before putting real capital at risk.
Sign up for free and start analysing and testing your options strategies with AlgoTest.