The Bank Nifty option chain is a table that lists every BANKNIFTY call and put option for one expiry, arranged by strike price. To read it, select an expiry, find the strike closest to the index price and compare calls and puts across nearby strikes. Open interest (OI) shows how many contracts are open, change in OI shows whether that number grew or fell, and volume shows how many contracts traded during the session.
These numbers can tell different stories at the same strike. On 16 October 2026, the 56,000 call was the most heavily traded call for the 27 October BANKNIFTY expiry. It also recorded the largest drop in call OI that day. Here’s how to read a row like that for yourself.
Read OI and volume on a live chain. Sign up free on AlgoTest to open the Bank Nifty option chain and replay past sessions.
Start With the Expiry and the At-the-Money Strike
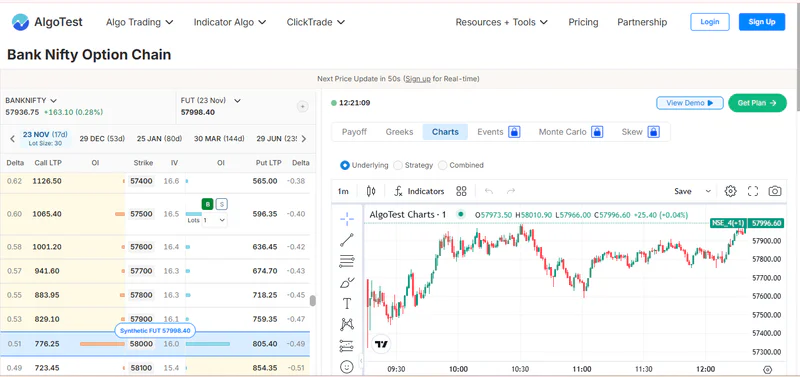
Open the Bank Nifty option chain and select one expiry. A 56,000 call expiring this month and a 56,000 call expiring next month are separate contracts. Keep the expiry fixed when you compare activity across strikes or over time.
Read across a single row. CE means the call, PE means the put, and both share the strike price shown in the middle. If Bank Nifty is at 55,840 and the nearby strikes are 55,800 and 55,900, then 55,800 is the closest strike to spot. This is the at-the-money (ATM) strike.
Start at the ATM strike and read one row above and below it. For the contract calendar, see Bank Nifty expiry dates and rules.
What the Bank Nifty Option Chain Columns Mean
The NSE option chain shows both OI and volume in contracts. Other platforms may show OI in units, or shorten it to thousands or lakhs. One Bank Nifty contract is 30 units, which has been the Bank Nifty lot size since January 2026. So 1,000 contracts of OI equal 30,000 units. Check the units before you compare figures across screens.
How to read volume in an option chain covers volume in more detail.
A Bank Nifty Option Chain Example Using Two Strikes
On 16 October 2026, Bank Nifty closed near 55,844. For the 27 October expiry, the 56,000 call had the highest call OI, while the 55,000 put had the highest put OI. The same two contracts also led their sides on 14 October, but their daily OI changes had reversed.
Each OI change compares that day with its own previous close. Volumes refer to the 16 October session. Sources: 14 October and 16 October chain summaries.
Read the call first. The 56,000 CE traded more than twice the volume of the 55,000 PE on 16 October. Yet fewer call contracts were open at that strike at the close than at the previous close. Traders were busy there, but more positions were closed than opened. Volume alone would have missed that.
Now read the put. The 55,000 PE already had the most open puts on 14 October, even though its OI fell that day. On 16 October, it still led in total put OI, and its OI rose. The ranking tells you where positions were concentrated. The change tells you whether that concentration grew or shrank in actual numbers.
What OI Tells You About Support and Resistance
These figures give you two levels to watch. Every open contract has a buyer and a seller, so OI alone can’t tell you whether traders sold the 55,000 put expecting support or bought it as protection. To judge a possible support level, watch how the index and the put premium behave as spot approaches that strike.
Watching the 56,000 call or the 55,000 put? Check a position’s payoff, breakeven and maximum loss (where defined) in the AlgoTest Strategy Builder before you place it.
How to Compare Two Snapshots During the Same Session
Suppose you’re following the same two strikes from 10:00 to 10:30 AM IST. The figures below are only an example and are separate from the October market data. All readings are in contracts.
In those 30 minutes, 2,400 call contracts traded and call OI fell by 400. On the put side, 1,800 contracts traded and put OI rose by 500.
To get the volume for the interval, subtract the earlier cumulative volume from the later one.
To get the OI change for the interval, subtract the earlier total OI from the later one.
This is also why your number can differ from the screen. If the call’s OI at the previous close was 11,000, its OI at 10:30 was still up 600 on the day, even though it fell 400 in the last half hour. Both readings are correct, but they answer different questions.
Practise reading OI on a past session
Open the AlgoTest Option Simulator and pick a past BANKNIFTY session.
Pause at a time you choose, and write down the spot price and the premiums at two nearby strikes.
Note what you expect if spot crosses one of them, then replay the next 30 minutes and compare.
Test an OI-based Bank Nifty strategy on past expiries. Sign up to get 100 Backtests free/month
Turn Bank Nifty OI Readings Into a Tested Plan
Find the strikes with the largest OI for your expiry, note whether that OI is building or unwinding, and decide in advance what you’ll do if spot reaches them. Then define your entry, exit and position size, and check the plan across past sessions before you trade it live.
AlgoTest helps you move from an idea to a strategy you can inspect and test before deciding whether to deploy.
Join us as we simplify algo trading in India.
Related Reading
FAQs
What is the difference between Bank Nifty call OI and put OI?
Call OI counts open call contracts, and put OI counts open put contracts. Compare them for the same expiry, and check whether you’re looking at one strike or the totals across all strikes.
Can Bank Nifty option volume rise while OI falls?
Yes. Volume counts every contract traded during the session. OI falls when more existing contracts close than new ones open, so a busy strike can end the day with fewer open positions.
Does the highest call OI always act as resistance?
No. It only shows the strike with the most open call contracts for the selected expiry, and Bank Nifty can trade through that strike. Watch how spot, the call premium and OI change as the index approaches it.
How do I calculate the Bank Nifty put-call ratio from the option chain?
For an OI-based PCR, divide total put OI by total call OI across all strikes for the same expiry. For example, 15 lakh put contracts against 12 lakh call contracts gives a PCR of 1.25. Our put-call ratio guide explains how traders read it.