Volume in an option chain shows how many contracts were traded at a particular strike during the trading session. It helps you see where market activity is concentrated, but it does not tell you whether traders are bullish or bearish.
For example, high Call volume may come from Call buying, Call writing, position closing or hedging. To understand what the activity could mean, you must compare volume with the option premium, Open Interest (OI), Change in OI, the movement in the underlying and liquidity.
What Is Volume in an Option Chain?
Option volume is the number of contracts traded in a specific option during a given period, usually the current trading day.
If the 82,500 Sensex Call shows a volume of 2 lakh, it means 2 lakh contracts have changed hands in that option during the session. It does not mean there were 2 lakh buyers plus 2 lakh sellers. Every completed contract has both a buyer and a seller, and the contract is counted once in volume.
Volume normally accumulates as trades take place during the session and resets for the next trading day. A strike showing 2 lakh volume at 2:00 PM may therefore have shown a smaller number earlier that day.
For Sensex options, the official BSE derivatives chain displays Volume and Open Interest in contracts.
The most important limitation is that volume does not reveal:
Whether buyers or sellers were more aggressive.
Whether the traders were opening or closing positions.
Whether the activity was directional, speculative or a hedge.
Whether the activity will continue after the volume spike.
That is why high volume should not be treated as a trading signal by itself.
Why Option-Chain Volume Matters?
Volume helps you identify where traders are active. Instead of analysing every strike in the chain, you can use it to narrow your attention to the contracts seeing meaningful participation.
Traders commonly use volume to:
Find actively traded Call and Put strikes.
Spot an unusual increase in activity.
Compare activity across nearby strikes.
Confirm whether a premium move has participation behind it.
Assess liquidity before selecting a contract.
High volume does not make a strike important automatically. A high-volume ATM option may simply be experiencing its normal daily activity. The more useful question is whether the volume is unusual for that contract, expiry and time of day.
Volume vs Open Interest in an Option Chain
Volume and Open Interest both measure participation, but they answer different questions.
Suppose a Sensex option has an OI of 1 lakh contracts and a daily volume of 50,000 contracts. The volume tells you how much activity occurred during the day. The OI tells you how many contracts remain open.
A trade can affect volume and OI differently:
If both sides open new positions, volume rises and OI increases.
If both sides close existing positions, volume rises and OI decreases.
If an existing position is transferred to a new participant, volume rises while OI may remain unchanged.
To explore this metric separately, read the guide to Sensex OI data.
What Does High Call or Put Volume Mean?
High Call volume only means that many Call contracts have traded. It could include Call buying, Call writing, short covering, long unwinding or a combination of these activities.
Similarly, high Put volume can result from Put buying, Put writing, position closing or portfolio hedging.
Therefore:
High Call volume is not automatically bullish.
High Call volume is not automatically resistance.
High Put volume is not automatically bearish.
High Put volume is not automatically support.
You need to check whether the option premium and OI are rising or falling before forming an initial interpretation. Even then, the conclusion remains a probability rather than proof of trader intent.
For a broader process covering OI, IV, PCR and strike selection, read How to Analyse the Sensex Option Chain.
How to Read Volume With Option Premium and OI
The option premium helps show which side is exerting pressure, while Change in OI shows whether the number of open positions is increasing or decreasing. Volume shows how much trading activity accompanied that change.
The following framework is commonly used as a starting point:
These are conventional interpretations, not fixed rules. An option premium also changes because of movement in the underlying, implied volatility and time decay. Use the table to form a hypothesis, and then check whether the other data supports it.
Volume strengthens the observation when the activity is unusually high. For example, a small premium change with normal volume may not deserve much attention. A sharp premium move, a meaningful OI change and unusually high volume occurring together may be more relevant.
How to Read Volume in an Option Chain Step by Step
1. Select the underlying and expiry
Volume must be read for a specific contract. Confirm that you are looking at the correct underlying and expiry before comparing strikes.
Weekly expiries often attract more short-term activity, while contracts with distant expiries may behave differently. Avoid comparing raw volume across expiries without considering this difference.
2. Identify the ATM strike
Find the strike closest to the current price of the underlying. Then review a reasonable number of strikes above and below it.
ATM and nearby strikes often trade more actively than far OTM strikes, so a high raw number near ATM may be normal. Compare each strike with nearby contracts rather than treating the largest number as a signal.
3. Look for unusual activity
Compare the current volume with:
The contract's usual volume at a similar time of day.
Nearby Call and Put strikes for the same expiry.
The rate at which trading activity is accelerating.
The underlying price movement occurring at the same time.
Comparing 10:30 AM volume with a normal full-day total can be misleading. A more useful comparison is the activity recorded at a similar point in previous sessions.
4. Check Change in OI
Ask whether open positions are increasing, decreasing or remaining broadly stable.
High volume with rising OI suggests that fresh positions are being added. High volume with falling OI suggests that existing positions are being reduced. Neither combination tells you the direction until you also examine the option premium and the underlying.
(Learn how to interpret Sensex OI data)
5. Compare the option premium
Check whether the premium is rising or falling while volume and OI are changing. Use the premium-and-OI framework above to develop an initial interpretation.
Do not use premium movement without context. A Put premium may rise simply because Sensex is falling, and a Call premium may fall because of time decay or a drop in implied volatility.
6. Check the movement in Sensex
Compare the option activity with the underlying index.
If Sensex is falling, a rise in Put premium accompanied by high volume and rising Put OI may indicate fresh Put buying or hedging. If a Call premium is falling while Call OI and volume rise, fresh Call writing may be taking place.
These interpretations become weaker when the Sensex price is flat or implied volatility is changing sharply.
7. Check liquidity before selecting a contract
Volume is one measure of liquidity, but it is not sufficient on its own. Also examine:
Open Interest.
Bid-ask spread.
Available quantity at the bid and ask.
How frequently the option trades.
Whether the contract is near expiry.
A liquid contract generally has active trading, meaningful OI and a relatively tight bid-ask spread. A contract can show high cumulative volume and still have poor execution conditions during a volatile period.
Related: Max Pain in Options Trading
Sensex Option-Chain Volume Example
Consider a hypothetical example where Sensex falls from 82,050 to 81,820 during the session. The figures below are illustrative and do not represent current market data.
Both strikes are seeing unusual activity, but volume alone does not explain it.
At the 82,500 Call, the falling premium and rising OI suggest possible fresh Call writing. At the 81,500 Put, the rising premium and OI suggest possible Put buying or hedging.
Together, these combinations are consistent with short-term bearish pressure. However, they do not guarantee that Sensex will continue falling.
Before drawing a conclusion, also check:
Changes in implied volatility.
Whether nearby strikes show a similar pattern.
Whether Sensex is approaching an important price level.
Whether the bid-ask spreads remain suitable for execution.
Volume helps you locate the activity. Premium, OI and the underlying price help you interpret it.
Related: PCR in Options Trading
Can Volume Be Higher Than Open Interest?
Yes. Volume can be higher than OI because the same contracts may change hands several times during a trading session.
For example, an option can have an OI of 10,000 contracts and record 25,000 contracts of volume during the day. This does not mean that 15,000 new positions were created. Some contracts may have been opened, closed or traded multiple times.
Change in OI shows the net change in outstanding positions. Volume higher than OI indicates heavy trading activity relative to the existing positions, but it is not a directional signal.
How Does Volume Help Identify Liquid Options?
Consistently traded options are generally easier to enter and exit, but no fixed volume threshold guarantees liquidity.
When selecting a contract, check:
Current trading volume.
Open Interest.
Bid-ask spread.
Available market depth.
Activity at nearby strikes.
A contract with high OI but low current volume may have many existing positions but limited activity during the session. A contract with high volume but low OI may be active today, although that liquidity may not continue.
For better execution, look for a combination of active volume, meaningful OI and a manageable bid-ask spread.
Related: Options Chart: How to Read Nifty, NSE & Sensex Option Chain Charts
Common Mistakes When Reading Option-Chain Volume
1. Treating high volume as a directional signal
Volume shows activity, not whether the activity is bullish or bearish.
2. Assuming high Call volume means resistance
A high-volume Call strike may include buying, writing, closing or hedging. OI and premium behaviour are needed before treating it as a potential resistance area.
3. Assuming high Put volume means support
Put buying and Put writing have very different implications. High Put volume alone cannot identify support.
4. Comparing unrelated contracts
Volume across different expiries or very different strikes may not be directly comparable. Start with contracts belonging to the same underlying and expiry.
5. Ignoring the time of day
Volume accumulates during the session. Compare activity at similar times instead of comparing early-session volume with a normal full-day total.
6. Ignoring the bid-ask spread
High displayed volume does not guarantee a good fill. Always check the current spread and market depth before placing an order.
Analyse Sensex Option-Chain Volume on AlgoTest
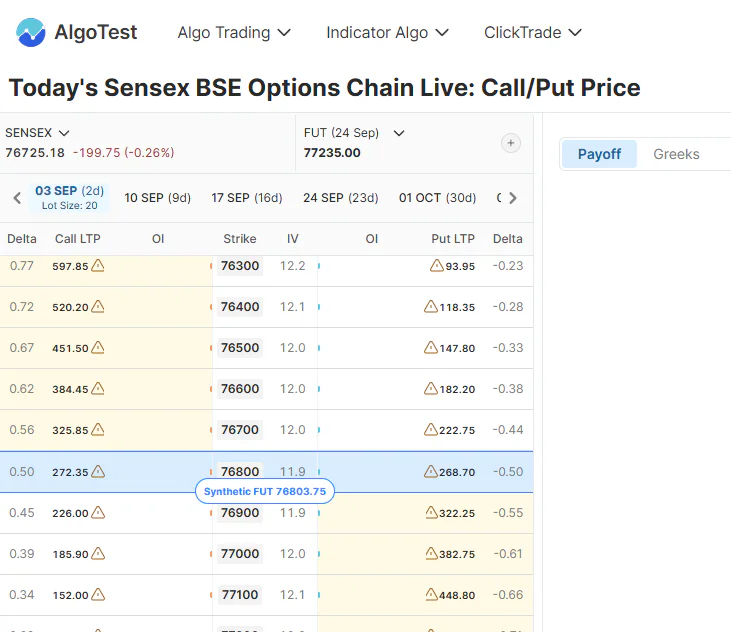
Option-chain volume helps you find where trading activity is concentrated. It becomes useful only after you compare it with option premium, Open Interest, Change in OI, implied volatility, the movement in Sensex and liquidity.
Do not treat the highest-volume strike as an automatic support, resistance or trade signal. Use volume to identify the contracts that deserve attention, and then use the other data to interpret what may be happening.
Use the AlgoTest to compare Call and Put data across strikes and expiries in one place.
Options trading involves risk. This article is for educational purposes and does not constitute investment advice.