How to Use a Straddle Chart for Intraday Options Trading
A straddle chart shows you premium behavior, which is arguably the most important element of options trading.
While a standard index chart shows you direction, a premium chart tells you whether a trade will actually make money.
A straddle chart helps traders understand if a market move has enough momentum and volatility to be tradable, making it one of the most effective filters for intraday options trading.
What is a Straddle Chart?
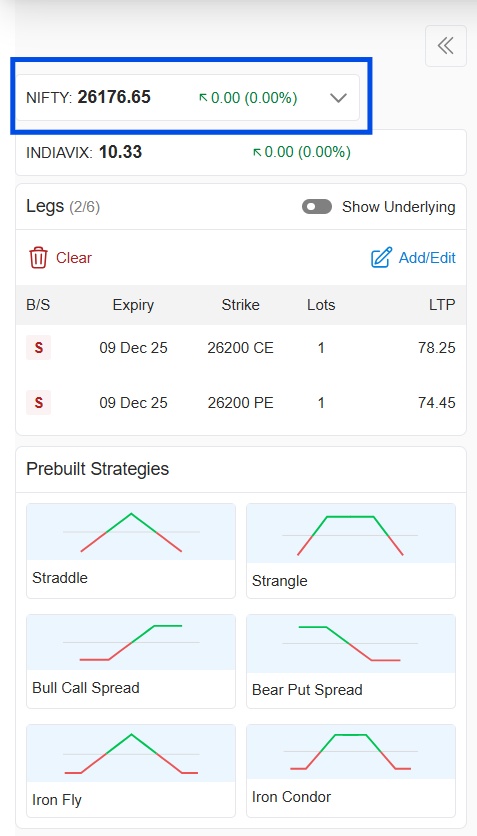
A straddle chart plots the combined premium of an At-The-Money (ATM) Call and Put option for the same strike and expiry. It helps traders track market volatility, directional momentum, and time decay in real-time.
In simple terms:
Nifty is at 22,500
Take the premium of the 22500 CE + the 22500 PE
Add them together → This is your Straddle Value
Plot this combined value as a line chart.
How to Read a Straddle Chart
To trade successfully, you need to understand why the straddle chart is moving. It is driven by three main factors: Volatility (Vega), Momentum (Gamma), and Time Decay (Theta).
1. Rising Straddle (The Buyer's Environment)
A rising straddle means the combined premium is increasing. This happens for two reasons:
Expanding Volatility (Vega): The market is getting fearful or highly active, pushing option prices up across the board.
Violent Momentum (Gamma): The market is moving in one direction so fast that the winning option is gaining value much faster than the losing option is losing it (e.g., the Call shoots up by ₹60, but the Put only drops by ₹40, netting a ₹20 gain).
What to do: Look for breakout trades. This is the ideal environment for Option Buying.
2. Falling Straddle (The Seller's Environment)
A falling straddle shows that premiums are bleeding out.
Time Decay (Theta) is dominating: The market might be completely range-bound, or volatility is dropping (IV Crush). The premiums are slowly decaying toward zero.
What to do: Avoid buying options at all costs. This is the ideal environment for Option Selling (like Short Straddles or Iron Condors).
3. Flat Straddle
A flat straddle shows a tug-of-war where neither momentum nor decay has a clear edge.
What to do: Sit on your hands. Wait for a clear trend to emerge.
Straddle Chart Interpretation Matrix
Combining Price Action with Premium Behavior
A straddle chart should never be used in isolation. You must combine it with the underlying index chart (e.g., Nifty or BankNifty) to decode the true nature of the market.
Price Breaks Out + Straddle Rises: Strong Move. Momentum is high, and premiums are expanding. This is a high-probability setup for option buyers.
Price is Range-Bound + Straddle Falls: Theta Market. The index is doing nothing, and premiums are melting. Great for option sellers; lethal for buyers.
Price Grinds Up/Down + Straddle Falls: The "Slow Grind". The index is trending, but it is moving so slowly that time decay (Theta) is eating away at the premiums faster than the directional move can add value. It is a "weak move" for premium buyers, but a highly profitable, low-stress environment for option sellers following the trend.
Visit AlgoTest Charts Doc to learn how to read a straddle chart.
The Expiry Day Effect
You must always factor in what day of the week it is when reading a straddle chart. A falling straddle on a Friday looks very different from a falling straddle on Expiry Day (Wednesday/Thursday).
On Expiry Day, the ATM straddle must eventually fall to zero (excluding intrinsic value if the market trends away). Because zero-DTE options have massive Theta decay, expect the straddle chart to naturally trend downward aggressively unless there is a massive, violent breakout.
Step-by-Step: Intraday Execution on AlgoTest Charts
To apply this logic in real-time, you need a clean, professional interface. Here is how to set up and execute your strategy using the AlgoTest platform.
Step 1: Open the Charts Module
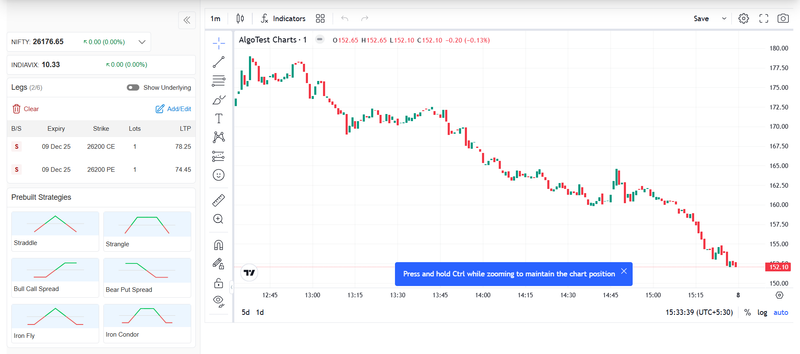
Log in to your dashboard and navigate to AlgoTest Charts. This tool allows you to plot synthetic charts like straddles that are often unavailable or difficult to configure on standard broker terminals.
Step 2: Select Index & Expiry
Index: Choose Nifty, BankNifty, or FinNifty.
Expiry: Always select the Current Weekly Expiry. Intraday premium behavior is most sensitive in the nearest expiry due to high Theta and Gamma activity.
Step 3: Select the Straddle Tool
Instead of manually searching for two different option symbols, select the Straddle option. The platform will automatically identify the ATM strike based on the current spot price and combine the Call and Put premiums into one continuous line.
Step 4: Apply VWAP (The "Line in the Sand")
Go to the indicators list and add VWAP. This serves as your institutional filter:
Straddle Above VWAP → The market is "Long Gamma" — premiums are expanding. This favors Buyers.
Straddle Below VWAP → The market is "Short Gamma" — premiums are melting. This favors Sellers.
Also Read: Understanding VWAP
Step 5: Watch the Opening 15–30 Minutes
The opening phase sets the tone. Let the initial morning volatility settle and observe whether the straddle stabilizes above or below the VWAP to establish your daily bias.
Rising & Above VWAP: Adopt a Buying bias. Look for directional breakout trades.
Falling & Below VWAP: Adopt a Selling bias. Look for iron condors, short strangles, or fading the edges of the daily range to collect Theta decay.
Learn more about Option Greeks.
Step 6: Execute with Confirmation
Keep your Index (Spot) chart open in a split window alongside your AlgoTest Straddle Chart.
The Confirmation: If the Index breaks a key resistance level and the Straddle is sharply rising, the move has "legs." This is a high-probability entry for an option buyer.
The "Bull Trap" Check: If the Index hits a new high but the Straddle stays flat or trends down, the move lacks conviction — buyers aren't bidding up premiums. Avoid the trade.
The "Hidden" Signals
The "Bull Trap" Signal: If the Index Price breaks to a new high but the Straddle Chart stays flat or falls, the move lacks conviction. This is often a "fakeout" where buyers aren't stepping in to bid up premiums.
The "Volatility Crush": After a major news event (like an RBI policy meet or Earnings), the Straddle Chart will often crash vertically even if the price doesn't move. This is IV Crush — the best time to be a seller and the worst time to be a buyer.
Strategies That Work with Straddle Charts
1. Breakout Confirmation (For Option Buyers)
Never trust a price breakout blindly. Use the straddle chart to confirm if the smart money is actually backing the move.
When to Enter: The index breaks a key support/resistance level AND the straddle chart is sharply rising.
Why it works: The rising straddle confirms that momentum (Gamma) and volatility (Vega) are expanding, meaning your option premium will multiply quickly.
Read more: Option Trading Strategies
2. Intraday Short Straddle (For Option Sellers)
When the market goes to sleep, option sellers get paid.
When to Enter: The index is stuck in a tight range AND the straddle chart is steadily falling (ideally rejecting the VWAP line).
Risk Warning: Short straddles carry undefined risk. Always use strict stop-losses on both the Call and Put legs (e.g., 25% above your entry price) to protect your capital if a sudden breakout occurs.
Common Mistakes to Avoid
Ignoring Premium Behavior: Looking only at the spot chart and wondering why your option isn't moving.
Buying Options During Decay: Entering long Calls or Puts when the straddle chart is trending downward. This is guaranteed capital destruction.
Trading Flat Markets: Forcing trades when the straddle shows no clear edge.
Entering Without Confirmation: Jumping into a trade before the 15-minute candle closes or before the straddle confirms the price action.
Also read: Intraday Trading Tips a Trader Must Know
Critical Risk Disclaimer
Options trading involves substantial risk. While a Rising Straddle favors buying, it does not guarantee direction — you can still lose money if you pick the wrong side (Call vs. Put). Conversely, selling options during a Falling Straddle carries theoretically unlimited risk. Never sell naked options without a strict stop-loss or a hedging strategy (like a Spread or Iron Condor) to protect against sudden "Gamma spikes" or black-swan market moves.
One Key Insight to Remember
A straddle chart does not predict direction. It will not tell you if Nifty is going to 22,600 or 22,400.
It tells you one thing: Whether the move has the strength to pay you.
Sign up now on AlgoTest and get 25 backtests/week free.
Related searches: Best options strategy builders,AlgoTest Simulator, How to read Sensex option chain,