When you open an option chain, the OI columns may contain some of the largest numbers on the screen. The difficult part is understanding what these numbers mean and whether they are useful for your trade.
High OI does not automatically mean the market will rise or fall. To use it correctly, you need to compare OI with Change in OI, price, volume, and Call and Put activity.
Let's see how OI works and how you can use it during option chain analysis.
What Is OI in Options Trading?
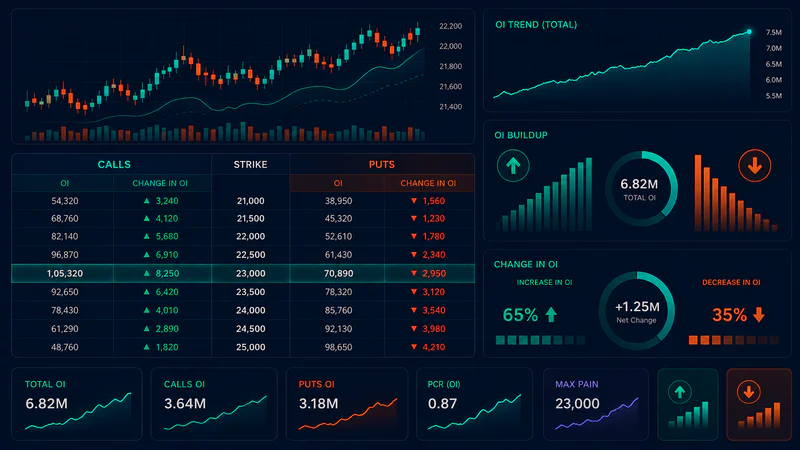
OI stands for open interest. It shows the total number of futures or options contracts that remain open.
These contracts have not been closed, exercised, or expired. Every contract has a buyer and a seller, but it is counted only once.
OI does not tell you whether buyers or sellers are right. It only shows how many contracts are still active.
How Does Open Interest Change?
OI changes when traders create, transfer, or close positions.
Consider this simple example.
This is why OI and trading activity are not the same. A contract may trade several times without creating the same increase in open interest.
Learn more about OI in our documentation
What Does OI Data Show in an Option Chain?
An option chain shows OI separately for Calls and Puts. You can check this data for every strike and expiry.
The main columns include.
OI, the number of contracts that are currently open.
Change in OI, the increase or decrease in open contracts during the period shown.
Volume, the number of contracts traded during the session.
LTP, the latest traded premium of the option.
Implied volatility, the expected volatility reflected in the premium.
Strike price, the price linked to the option contract.
Expiry, the date on which the contract expires.
You do not need to study every column at once. Start with OI, Change in OI, volume, LTP, strike price, and expiry.
You can learn more about volatility in the guide to implied volatility and how to read IV.
OI vs Change in OI vs Volume
OI, Change in OI, and volume answer different questions.
Volume normally resets at the start of each trading day. OI continues until positions close or the contract expires.
Suppose an option records volume of 50,000 contracts but OI increases by only 5,000. This means trading activity was high, but only 5,000 additional contracts remained open.
You can read the full comparison in the guide to volume in an option chain.
How to Read Price and OI Together
You can compare price movement with OI movement to understand whether positions are building or being closed.
This framework works most clearly with futures contracts.
Rising price with rising OI may show that fresh long positions are entering. Falling price with rising OI may show that fresh short positions are entering.
Rising price with falling OI may indicate short covering. Falling price with falling OI may indicate that existing long positions are closing.
Be careful when applying this framework to options. The underlying price and the option premium are different.
Every option also has a buyer and a seller. OI alone cannot tell you who started the trade or whether the position is part of a hedge.
Call vs Put OI, What Is the Difference?
Call vs Put OI compares open positions on both sides of the option chain. It helps you see where positions are concentrated around the current market price.
You may see traders treat high Call OI as possible resistance. High Put OI is often treated as possible support.
These levels are not guaranteed. OI cannot tell you whether the positions belong to buyers, sellers, spreads, or hedges.
Treat high OI strikes as zones to watch. Then check how price and Change in OI behave around those zones.
You can also use OI while choosing the right strike price. However, you should also consider liquidity, implied volatility, premium, and the bid and ask spread.
How Does Put Call Ratio Use OI?
The Put Call Ratio, or PCR, compares Put activity with Call activity.
An OI based PCR is calculated by dividing total Put OI by total Call OI for the selected expiry.
PCR can help you understand the overall balance between Call and Put positioning. However, you should not use one PCR value as a direct buy or sell signal.
You can read the complete formula and interpretation in the guide to Put Call Ratio.
How Are OI and Max Pain Connected?
Max pain is calculated using open interest across different strikes. It estimates the strike where option writers would have the lowest total payout at expiry.
This does not mean the market must close at the max pain strike. Strong price moves, news, or changes in OI can make the earlier level less useful.
Read more about the calculation and its limitations in the guide to max pain in options trading.
A Simple Call vs Put OI Example
Suppose Sensex is trading near 82,100 for a selected expiry. The following figures are hypothetical and do not represent current market data.
This does not prove that Sensex will remain between 81,500 and 82,500. It only tells you where open positions are concentrated.
Suppose Call OI at 82,500 begins to fall while Sensex moves above the strike with stronger volume. This may indicate that the upper zone is weakening.
If Put OI at 81,500 falls while Sensex moves lower, the lower zone may also be losing importance.
For a deeper index-specific explanation, read the guide to Sensex OI data.
Where Can You Check Live OI Data?
You can check OI and Change in OI on exchange option chains and options trading platforms.
The NSE OI data page publishes open interest information for NSE derivatives. Always check the latest exchange data before using an OI level.
For BSE Sensex options, you can use the live Sensex Option Chain on AlgoTest. It lets you compare Call and Put OI across strikes and expiries.
You can also check option premium, volume, implied volatility, and other option chain data in the same view. This makes it easier to compare OI with the other factors that affect your analysis.
If you want a wider walkthrough, read how to analyse the Sensex Option Chain.
For Nifty, use the detailed guide to Nifty OI data.
Common Mistakes When Reading OI
1. Treating high OI as guaranteed support or resistance
High OI shows that many contracts are open at a strike. It does not guarantee that price will stop there.
2. Ignoring Change in OI
A strike may have high total OI even when traders are closing positions. Always check whether OI is increasing or falling.
3. Assuming OI reveals buyers or sellers
Every contract has a buyer and a seller. OI cannot tell you whether a large position is a directional trade, a spread, or a hedge.
4. Comparing different expiries
Each expiry has its own OI structure. Compare Calls and Puts from the same expiry.
5. Looking only at OI
OI is only one part of option chain analysis. Compare it with price, volume, premium movement, implied volatility, and liquidity.
If you need to understand how the market premium is affected by volatility and time, read the guide to the option premium calculator.
A Practical OI Checklist
Before using OI in your analysis, check the following points.
Use the correct underlying and expiry.
Start with the ATM and nearby strikes.
Mark the highest Call OI and Put OI zones.
Track Change in OI instead of relying on one reading.
Compare OI with the underlying price.
Check the option premium and volume.
Review implied volatility and liquidity.
Treat support and resistance as changing zones.
Define your risk before entering a trade.
Use OI as Context, Not a Standalone Signal

OI data helps you see where futures and options positions remain open. Change in OI helps you see whether that positioning is building or weakening.
Call vs Put OI can help you identify strikes that deserve closer attention. It cannot predict where the market will move next.
Use OI with price, volume, premium behaviour, volatility, and expiry context. If you trade Sensex options, you can use the AlgoTest Sensex Option Chain to study live strike-wise data before evaluating a setup.
Options trading involves risk. This article is for educational purposes and does not provide investment advice.