An OI spurt is a sudden, outsized change in open interest in a derivatives contract over a single session. NSE publishes a dedicated page ranking contracts by how much their open interest has moved against the previous day.
The page is a screener, not an analysis tool. It answers one question: where in the F&O universe is positioning changing fastest right now?
That is useful because most traders watch the same four or five index strikes and miss activity elsewhere in the market. We'll cover where the data sits, how to read it, and what the numbers can and cannot tell you.
What Are OI Spurts?
Open interest counts the contracts currently outstanding in a futures or options contract. A contract stays in the count until both sides close it out or it expires.
An OI spurt is a large percentage move in that count within one session. There is no official threshold. As an illustrative starting filter, many traders look at moves of 10% or more against the previous day's open interest, then tighten or loosen that depending on the instrument.
The word "spurt" is slightly misleading. The data shows both increases and decreases, so it captures positions being built and positions being abandoned. Both matter.
What makes a spurt significant is that it is fresh. A stock carrying large open interest that has not moved in a week is telling you about old positioning. A stock whose open interest jumped 30% today is telling you something is happening now.
The calculation
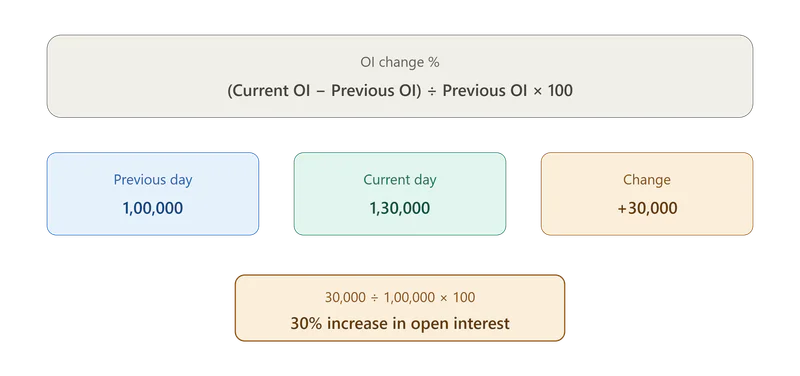
OI change % = (Current OI − Previous OI) ÷ Previous OI × 100
If a contract held 1,00,000 contracts yesterday and holds 1,30,000 today, that is a 30% increase. The arithmetic is the easy part. What the figure means depends on the price move, the traded volume and how close you are to expiry, all covered below.
Where to Find NSE OI Spurts Data
This trips up a lot of traders, so it is worth being precise.
The page sits at nseindia.com/market-data/oi-spurts, but NSE now labels it "Change in Open Interest" on the site itself. In the Market Data menu, look under Derivatives for "Change in Open Interest" rather than searching for "OI Spurts". The URL kept the old name, which is why the term stays in wide use even though the on-page heading has changed.
A few practical notes:
It updates through the trading session and carries an "as on" timestamp, so the figures are live rather than end-of-day.
It covers both index and stock derivatives, so Nifty and Bank Nifty appear alongside individual F&O stocks.
There is a CSV download button, which is the easiest way to pull the data into a sheet for your own filtering.
It sits alongside related NSE tools including Most Active Contracts, Most Active Underlying and the Option Chain.
Do not confuse it with Volume Gainers, which is a separate page under the Capital Market section and measures something different.
The Two Levels of Detail
The page is not a single table. It offers views at two different levels, and knowing which one you are looking at changes what the numbers mean.
By Underlying aggregates open interest change across all contracts on a symbol. This is the view most people mean when they talk about OI spurts. It tells you that positioning in a stock or index has shifted, without saying where.
By Contracts drills into individual contracts, including instrument type, expiry, strike price, option type and last traded price. This is where you find out which strike the activity is actually in.
Contract-level data is further organised by the relationship between the open interest move and the price move, separating contracts where open interest and price rose together from those where they moved in opposite directions.
Those four combinations are the standard framework for reading OI, and we walk through what each one signals in our guide on how to read Nifty OI data.
For a full picture of a single underlying across every strike at once, the option chain remains the better tool, and we cover reading it in our guide on how to read the Nifty option chain.
Reading the Numbers
Why % change matters more than absolute change
A liquid name like Reliance can add a large absolute number of contracts and barely register as a percentage, because its base open interest is already huge. A mid-cap F&O stock can add a much smaller absolute number and show a 40% jump.
The percentage figure is what surfaces the second case, and the second case is usually the more interesting one. A 40% move means the positioning profile of that contract has genuinely changed today.
Absolute change still has a use, but read it carefully. It measures the change in outstanding positions, not money. Comparing monetary exposure across symbols means accounting for contract sizes and prices, which is why the value columns on the page are more useful than the contract count for that purpose.
Volume is your reality check
An OI change with almost no volume behind it deserves suspicion. Thin trading can produce readings that do not reflect any real shift in positioning.
When both volume and open interest move together, you at least know real participation is behind the change.
Using OI Spurts to Screen Stock F&O
Most retail attention sits on Nifty and Bank Nifty. This list covers the whole F&O universe, which means it surfaces names you would not otherwise have looked at.
A workable screening routine:
Sort by percentage change in open interest and take the top 15 to 20 names.
Drop anything where volume looks thin relative to the OI change.
Note whether the open interest rose or fell, because a build-up and an unwind point in opposite directions.
Pull up the price move for each remaining name, since open interest on its own tells you nothing about direction.
Switch to the contract view for anything interesting, to see which expiry and strike the activity sits in.
Check whether news explains the move, such as results, a corporate announcement or a sector event.
That last step matters. A stock with a large OI jump the day before its earnings could be hedging, speculation, or both at once. The data shows that positions were created. It cannot tell you why.
What OI Spurts Cannot Tell You
The page gives you one input. It does not give you a trade.
It does not show direction. Open interest rising tells you positions are being created, not whether the people creating them are bullish or bearish. You need the price move alongside it.
It does not reveal motive. A hedge against an existing holding and a directional bet produce identical open interest increases.
It does not account for expiry effects. Open interest behaves differently in the last few sessions before expiry, when rollovers inflate the numbers in the next series and deflate them in the current one. That is position management, not fresh conviction.
It does not tell you who is positioned. For that you need NSE's participant wise open interest report, which splits F&O positioning across FII, DII, Client and Pro categories.
Common Mistakes When Reading OI Spurts
Traders treat a high percentage change as a buy signal on its own, when the figure carries no directional information by itself.
Traders read the By Underlying view and assume they know which strike the activity is in, when that requires the contract-level view.
Traders compare absolute contract changes across symbols as though they represent comparable amounts of money.
Traders focus only on open interest increases and skip the decreases, missing cases where a crowded position is being abandoned.
Traders check the page once in the morning and assume the picture holds, when intraday open interest can shift substantially by the afternoon.
Traders screen the list and place a trade the same hour, without ever testing whether the pattern has worked historically.
Read more: 5 Algo Trading Mistakes Retail Traders Make
Turning an OI Spurt Into a Testable Idea
Screening is the easy part. The harder question is whether acting on these signals actually makes money.
An OI spurt observation becomes a strategy only once you define it precisely: which percentage threshold, which volume filter, what price confirmation, what entry timing, what stop. Vague rules cannot be tested, and untested rules are just opinions.
Once the rules are specific, you can check the resulting strategy against history rather than against memory.
How to backtest options strategies walks through the process, and paper trading lets you run the approach in live conditions before any capital is at risk.
Check out the best Paper Trading Websites for Algo Trading.
Screening the Whole F&O Market Instead of a Handful of Contracts
OI spurts show you where derivatives positioning is changing across the entire F&O universe, not just the few contracts most traders keep open on screen.
Skipping it means your view of the market is limited to what you already happened to be watching, which is a narrower slice than most traders realise.
Where a screener stops, testing begins. AlgoTest lets you turn an options strategy into precise rules, backtest it across years of data with slippage and brokerage included, then Forward Test it in live conditions before committing capital. Every account gets 25 free backtests each Monday, so you can test your strategy on AlgoTest before risking anything on it.
New to the platform? The AlgoTest documentation walks through building strategies, running backtests and going live, step by step.