You open an option chain before a trade and see rows of Call and Put options, strike prices, Open Interest, volume, change in OI, IV, and option prices. With so much data on the screen, knowing what matters can be difficult.
Option chain analysis helps you make sense of this data. By studying OI, change in OI, price, volume, PCR, and Max Pain, you can understand where options activity is concentrated and identify potential support and resistance levels.
Let's learn how to read an option chain and focus on the data that matters most.
What Is Option Chain Analysis
An option chain is a list of available Call and Put options for an underlying asset and a particular expiry. The NSE option chain lets you select the underlying, expiry and strike price to view available option contracts.
Option chain analysis means studying this data to understand how traders are positioned across different strike prices.
For example, you may notice that a large amount of Put Open Interest is sitting at one strike, while a large amount of Call Open Interest is sitting at another. These levels may be worth watching as potential support and resistance.
The main data points you need to focus on are.
Last traded price
Open Interest
Change in Open Interest
You do not need to analyse every number on the screen. The key is to understand what each data point tells you and then look at them together.
How to Read an Option Chain
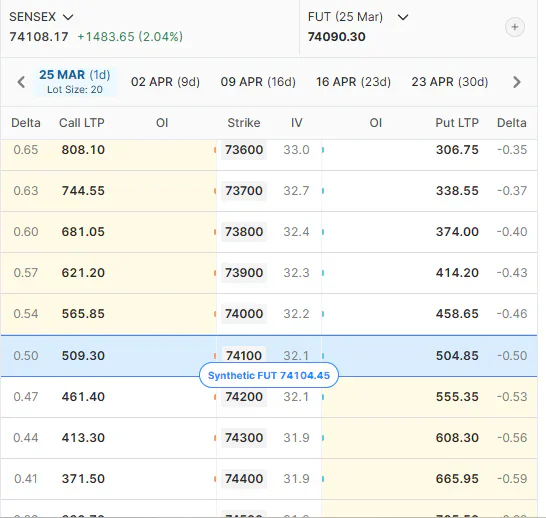
An option chain normally shows Call data on one side and Put data on the other, with the strike price in the middle.
The exact layout can differ between platforms, but the main information remains similar.
1. Strike Price
The strike price is the price at which the option contract is defined.
When you analyse an option chain, you usually compare several strikes around the current price of the underlying.
For example, if Nifty is trading at 25,000, you may look at strikes such as 24,800, 24,900, 25,000, 25,100 and 25,200.
2. LTP
LTP means Last Traded Price. It shows the most recent price at which the option was traded.
You can use LTP to see how the option premium is moving, but LTP alone does not tell you why the option price is moving.
3. Volume
Volume shows how many contracts have been traded during a given period.
Higher volume means there has been more trading activity at that strike. You should still look at volume along with Open Interest and price.
4. Open Interest
Open Interest, or OI, represents the number of outstanding option contracts.
It is different from volume. Volume measures contracts traded, while OI measures contracts that remain open.
This makes OI one of the most useful parts of option chain analysis.
5. Change in OI
Change in OI shows whether Open Interest has increased or decreased.
This becomes more useful when you compare it with the movement in the option price.
6. Implied Volatility
Implied Volatility, or IV, reflects the volatility level implied by the option price.
For basic option chain analysis, you do not need to make IV the centre of your analysis. You can use it as an additional data point when comparing options.
How to Use Open Interest in Option Chain Analysis
Open Interest can help you see where option positions are concentrated.
A common approach is to look at the strikes with high Call OI and high Put OI.
1. What Does High Call OI Mean
High Call OI at a strike can indicate significant positioning at that level.
When Call writing is also taking place and the underlying is struggling below the strike, traders may treat that level as potential resistance.
For example, if Nifty is trading at 25,000 and 25,200 Call OI is much higher than nearby strikes, 25,200 becomes a level worth monitoring.
High Call OI does not guarantee that the market will stop at that strike. Positions can change as the market moves.
2. What Does High Put OI Mean
High Put OI can indicate significant positioning on the Put side.
When Put writing is taking place and the underlying continues to hold above the strike, traders may treat that level as potential support.
For example, if Nifty is trading at 25,000 and 24,800 Put OI is significantly higher than nearby strikes, 24,800 may become a level to watch.
Again, high Put OI does not guarantee support.
3. How to Read Change in OI
Change in OI can give you more context than looking at total OI alone.
You can compare the option price with its change in OI to get a basic view of how positions may be changing.
These are common interpretations, not guaranteed signals.
The same OI change can have different meanings depending on the broader market and the positions traders are taking. That is why you should combine OI with price movement rather than using it on its own.
How to Find Support and Resistance Using Option Chain Analysis
One of the most common uses of option chain analysis is to identify potential support and resistance.
You can start by looking for strikes where Call and Put OI is concentrated.
Potential Support
A strike may be monitored as potential support when you see.
Strong Put OI
Increasing Put OI
Put writing
Price holding above the strike
Potential Resistance
A strike may be monitored as potential resistance when you see.
Strong Call OI
Increasing Call OI
Call writing
Price struggling below the strike
A Simple Example
Suppose Nifty is trading at 25,000.
You notice that.
In this example, 24,800 and 25,200 become important levels to monitor.
If Nifty moves higher and Call OI at 25,200 starts falling, the resistance picture may change. If Nifty falls and Put OI at 24,800 starts falling, the potential support may weaken.
This is why you should keep watching how OI changes instead of treating a single OI figure as a fixed level.
How to Use PCR in Option Chain Analysis
PCR stands for Put Call Ratio.
It compares Put activity with Call activity. One common version uses Open Interest.
PCR equals total Put OI divided by total Call OI.
For example, if total Put OI is 12 lakh contracts and total Call OI is 10 lakh contracts, the PCR is 1.2.
A relatively high PCR means Put OI is higher compared with Call OI. A relatively low PCR means Call OI is higher compared with Put OI.
PCR can help you understand the broader positioning in the options market.
However, you should not use one PCR value as a direct buy or sell signal.
PCR can remain high or low while the market continues in the same direction. Use it with price action, OI, change in OI and important strike levels.
If you are analysing SENSEX options, first select the expiry you want to study because each expiry has a different OI structure and PCR value. You can check the current ratio on the live SENSEX Option Chain, along with Call and Put OI, Change in OI, volume, Max Pain and spot-price movement.
Instead of looking at the PCR once, observe how it changes during the session. This can help you understand whether the balance between Put and Call positioning is shifting.
How to Use Max Pain in Option Chain Analysis
Max Pain is another data point you can find in an option chain. It shows the strike price where option buyers would face the highest combined loss at expiry, based on the current Open Interest.
Traders often watch Max Pain as expiry approaches. If the Max Pain level is close to the current market price, it can be useful as an additional reference point.
However, Max Pain is not a guaranteed expiry price. Use it to understand option positioning, not as a prediction of where the market will close.
Option Chain Analysis for Intraday Trading
You do not need to stare at the entire option chain throughout the trading session.
A simple process can make your analysis easier.
Before the Market
Start by checking.
Current spot price
Expiry
Major Call OI levels
Major Put OI levels
Previous important levels
Mark the strikes that could become important during the session.
During the Market
Keep an eye on.
Change in OI
Price movement
Volume
Call and Put OI shifts
Whether important levels are holding or breaking
For example, suppose a strike has high Put OI and you are treating it as potential support.
If Nifty continues to hold above that level and Put OI keeps increasing, the setup may remain worth watching.
If Nifty breaks the level and Put OI starts falling, the situation has changed.
Before Taking a Trade
Do not take a trade simply because you see high OI.
Before entering, define.
Your market view
Entry condition
Stop loss
Target
Position size
Option chain analysis can help you identify a setup. Your trading plan still needs to define how you will manage the trade.
Nifty, Bank Nifty and Sensex Option Chain Analysis
You can use the same basic option chain analysis approach for Nifty, Bank Nifty and Sensex.
Start with.
Call OI
Put OI
Change in OI
Price
Volume
Important strikes
The exact levels will change with the underlying and expiry, so you should analyse the current option chain rather than relying on old levels.
If you regularly trade these indices, you can also use dedicated option chain pages to focus on the contracts and strikes that matter to you.
Related: BSE Sensex Option Chain Explained: How to Read, Analyse & Trade Using Live Data
How AlgoTest Can Help You Test an Option Chain Setup
Option chain analysis can help you identify a potential trading setup. The next step is to see whether that setup works across different market conditions.
With AlgoTest, you can turn an options idea into a strategy and test it using historical data. Its Strategy Builder lets you create multi leg options strategies, while the Simulator lets you test strategies using historical option chain data.
You can then review the results and decide whether the strategy fits your trading plan before taking it live.
Common Mistakes in Option Chain Analysis
Looking Only at OI
High OI does not automatically mean support or resistance. Always consider price movement and change in OI as well.
Ignoring Change in OI
Total OI shows where positions are concentrated, while change in OI shows how that positioning is changing.
Using PCR Alone
PCR can provide useful context, but it should not be the only reason for taking a trade.
Treating Max Pain as a Prediction
Max Pain can help you understand positioning around expiry, but it does not guarantee where the market will close.
Ignoring Price Action
Option chain data shows options positioning. Compare it with the underlying price before making a trading decision.
Conclusion
Option chain analysis does not have to be complicated.
Start with Call and Put OI, change in OI, price and volume. Use them to identify potential support and resistance, then use PCR and Max Pain as additional data points.
Most importantly, do not rely on a single indicator as a guaranteed market signal. If you find a setup that looks promising, test it before putting real money behind it.
Join 45,000+ traders using AlgoTest to build, test, and automate rule based trading strategies. Get 25 backtests free and start testing your next strategy today.
Additional Resources
Trading Tools
Disclaimer: This article is for educational purposes only and does not constitute investment or trading advice.