Participant wise open interest is NSE's daily breakdown of outstanding equity futures and options positions across four groups: Client, DII, FII and Pro. It shows each group's long and short contract counts across index futures, stock futures, index options and stock options.
Traders use the report to compare positioning across sessions. A change in FII net positions, for example, may come from additional longs, fewer shorts or a combination of both. Reading the separate columns helps you understand that difference.
If you are new to outstanding contracts and OI changes, start with our guide on how to read Nifty OI data.
The Four Participant Categories
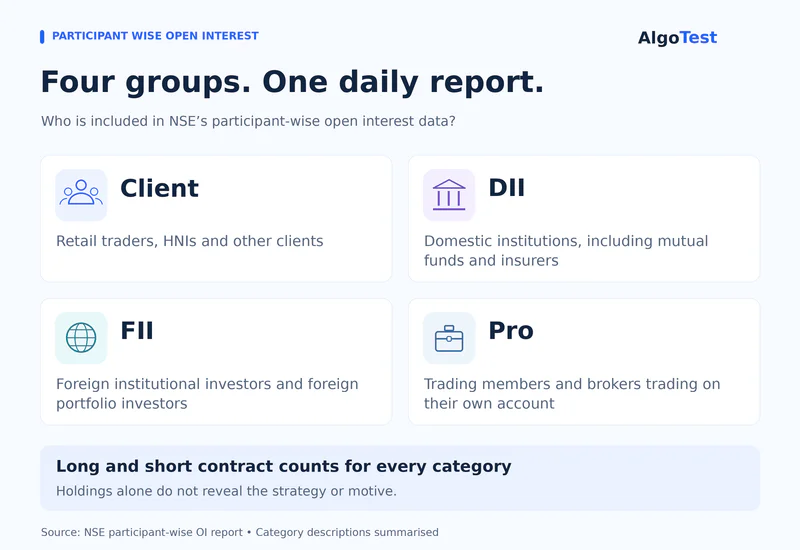
NSE groups the positions in this report into four categories.
Client wise open interest should therefore not be treated as a separate tally of inexperienced retail traders.
DIIs can hold substantial derivatives positions. For example, an arbitrage fund may buy shares in the cash market and sell corresponding futures to capture a price difference. SEBI's explanation of arbitrage mutual funds describes this approach. The short futures leg does not, by itself, establish a bearish view on the stock.
Every outstanding contract has a long side and a short side. Across the four categories, total long and short counts balance within each corresponding instrument group. A category being net long therefore means the other categories, combined, are net short by the same number of contracts.
What Does the Report Show?
The report separates four broad instrument groups. Options are also divided into calls and puts.
These are aggregate contract counts. The index-futures figures are not a Nifty-only breakdown, and the options columns do not identify individual strikes or expiries.
The CSV also includes total long and total short contract columns. Those totals combine different instruments, so a single net figure calculated from them does not describe the portfolio's overall directional exposure. A futures contract, a call and a put have different risk characteristics.
Where to Download Participant Wise Open Interest on NSE
To download the official data:
Open the NSE derivatives reports page.
Select the trading date you want to examine.
Locate F&O - Participant wise Open Interest (csv) and download the file.
Open it in a spreadsheet and download the previous session's report for comparison.
The file name follows the pattern fao_participant_oi_DDMMYYYY.csv. Check the date inside the report before using it.
NSE publishes this end-of-day report after market close. Availability can vary, so check the report date rather than relying on a fixed evening release time.
It does not provide live intraday changes by participant category. An option chain can help you inspect contract-level OI during the session, but it does not identify those positions as belonging to FIIs, DIIs, Clients or Pro traders.
Want to evaluate an options strategy before trading it? Sign up on AlgoTest to explore backtesting and paper trading.
How to Read Participant Wise OI Data
Start with one instrument group and compare the same columns across trading sessions. Index futures provide a straightforward place to learn the calculations, although their positions can still form part of hedges.
Calculate the net position
For each participant category:
Net position = Long contracts - Short contracts
A positive result means the category holds more long contracts than short contracts in that instrument group. A negative result means it holds more shorts than longs.
Compare long and short positions separately
Consider this hypothetical FII index-futures example:
The net position improved by 20,000 contracts because shorts decreased. Long positions did not increase, and FIIs remained net short.
This distinction matters when reading headlines about improving FII positioning. A less negative net position is different from a move into net-long territory.
Changes in total market OI add context, but they do not identify exactly how one participant category changed its holdings. Compare that category's long and short columns first.
Calculate the FII long-short ratio
Two different measures are often discussed when analysing FII OI data:
Always state which formula you are using. A long-short ratio of 0.67 and a long-position percentage of 40% describe the same example, but they are different calculations. If short contracts are zero, the long-short ratio cannot be calculated by ordinary division.
Compare the measure across several sessions, and examine the underlying counts. A ratio alone cannot tell you whether positions were added or reduced.
Reading Options Positions and Cash-Market Flows
Keep the options columns separate from index futures. Increased short-put positions, for example, do not reveal the strikes involved, whether the positions belong to spreads, or what other assets hedge them. The report cannot establish support or resistance levels from participant totals alone.
FII and DII cash-market activity measures something different from participant wise OI:
An FII short-futures position alongside cash-market buying could be part of a hedge or arbitrage strategy. However, the two reports aggregate many investors and desks, so you cannot assume they describe the same underlying trade.
Common Mistakes to Avoid
Treating a category as one trader. Each group combines participants with different positions, mandates and time horizons.
Assuming institutions must be right. The report contains positions, not evidence of a profitable trading signal.
Reading contract counts as capital invested. Prices, lot sizes and instrument types affect monetary exposure.
Ignoring expiry and rollover activity. Positions can move between contract series. The aggregate report does not show that expiry breakdown.
Calling every improvement fresh buying. A net position can improve through reduced shorts without any increase in longs.
Treating the report as live data. Check the trading date and distinguish previously reported positions from current-session activity.
Testing a Rule Based on Participant Data
If your research also uses changes during the trading session, our guide to OI spurts on NSE explains how to find sharp changes in open interest and assess them alongside price, volume and expiry.
Participant reports show each category's positions after the close, while the OI spurts screener helps you investigate changes in individual contracts during the session. The screener does not identify the participants behind those changes, so keep that distinction clear when defining your rule.
Use Participant Data With a Defined Trading Plan
Participant wise open interest is most useful when you compare how each group's long and short positions change across sessions. It adds context to a market view, but any trade you consider still needs clear entry, exit and risk rules.
For the next step, explore AlgoTest's options Strategy Builder to assemble option legs and review payoff graphs, breakeven levels and Greeks. Use that analysis to examine how your proposed position responds to different market scenarios and whether its risk fits your plan.
Join us as we simplify algo trading in India. Sign up on AlgoTest.