A "D" marker next to an NSE or BSE symbol on TradingView means delayed data. The prices on your chart are 15 minutes behind the live market.
Free users on TradingView in India are now seeing 15-minute-old numbers on Indian exchange symbols. This is not an outage or a browser fault, and logging out and back in will not clear it.
What the delay actually affects
The impact depends on how you trade.
Intraday and scalping setups break, because entries and stops are being read off stale candles.
Option premiums move fast, so a 15-minute-old premium is close to useless for a seller managing a position.
Swing and positional setups barely change, since a daily close is still a daily close.
Only Indian exchange data is involved. US stocks, crypto and other markets on the platform are unaffected.
Is it the data, or something else?
Delayed data is the common cause right now, but it is not the only reason a chart misbehaves. Check this list first.
Prices frozen with a "D" badge. This is the delay, not a fault. Logging out and back in does not remove it.
Chart loads but candles stop updating. Usually a lost connection. Free accounts also cap how many charts stay connected at once, so close extra tabs and reload.
Chart does not load at all. Clear your cache, switch off ad blockers on the page, or try another browser.
Indicators disappeared. The free plan limits how many indicators run on one chart, and anything above the limit is dropped.
One symbol shows no data. Check the exchange prefix, since NSE and BSE symbols pull from different feeds.
Everything works except Indian symbols. That points at the data entitlement rather than the platform.
Why exchange data gets delayed
Exchange data is licensed, not free. Real-time feeds from Indian exchanges carry terms and fees, and platforms have to confirm which users are entitled to what.
Delayed data is the standard fallback when an account is not entitled to the live feed. Nothing is broken, and no trader did anything wrong.
What TradingView's own rules say
TradingView's support documentation covers futures and options on the two Indian exchanges.
Two things are worth knowing about this table. It covers futures and options, and the rules for cash equities may differ. Reports from traders this week also vary, with some restoring live data by completing their exchange agreement and others still seeing the delay.
So treat the table as a starting point, not as the answer for your account.
Check out The Best TradingView Alternatives in India
What to check before you pay
Work through these in order. Paying should be the last step, not the first.
Check your data status inside TradingView. Open a chart, click the data status label at the top, and see what your account is entitled to and whether an exchange agreement is pending.
Check whether a free trial is available on your account before buying anything, so you can confirm an upgrade actually solves your problem.
Open your broker's own terminal. Broker apps show live prices through the broker's exchange entitlement. Note that connecting a broker to TradingView does not always restore live data on the chart itself.
Ask what you actually need. If you look at daily charts and hold positions for days, a delay changes very little.
Compare what you get elsewhere first. If live Indian charts are all you need, other platforms provide them free, so a paid plan may be solving a problem you do not have.
Charting on AlgoTest
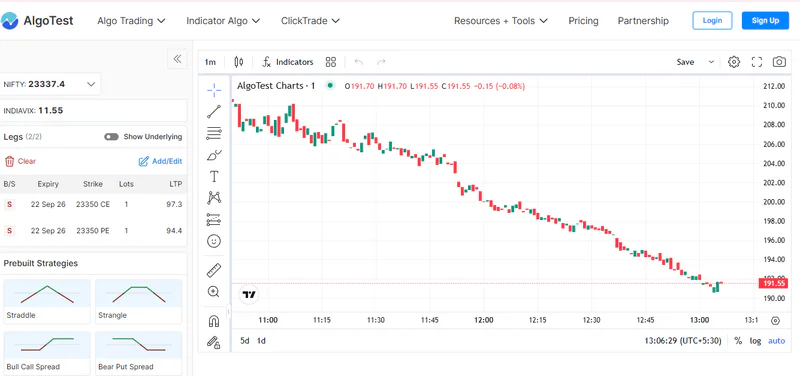
If the delay has you looking at other options, AlgoTest Charts run on live Indian market data. They were also built for a different job: watching what an options trader actually trades, not only the index behind it.
Charts for the instrument you are in
Live prices on Indian market data, so what you see on the chart is what the market is doing now.
Index charts for Nifty, Bank Nifty and Sensex.
Option premium charts by strike and expiry, so you follow the contract you hold rather than inferring its move from spot.
Standard candlestick timeframes, indicators and drawing tools, so the workflow feels familiar.
Multi-leg views most charting tools do not have
Pick your legs and watch the combined premium of a straddle, strangle or spread as one series.
Prebuilt templates for common structures, so a straddle is two clicks rather than a manual setup.
India VIX and the underlying alongside the position, so you see the context and the contract together.
This matters because a spot chart cannot answer the question an option seller cares about. Nifty moving 40 points tells you little. What your 23350 straddle did with that move tells you everything.
Related: TradingView vs GoCharting vs Signals AI: Best Platform for Indian Traders?
The rest of the workflow in the same place
Backtesting, so a setup is checked against history before real money touches it.
Paper trading, to run the idea forward without risk.
Automation, to execute it through your existing broker.
You do not need a new demat account, and signing up is free.
Product documentation of AlgoTest charts
Conclusion
If your charts went delayed, check your data entitlement inside TradingView first, then look at whether a trial is available, and use your broker's terminal in the meantime. A paid plan is worth it only if real-time Indian data is genuinely central to how you trade.
It is also worth asking how much of your process depends on a single chart. AlgoTest gives you live index and option premium charts alongside backtesting, paper trading and automation, explore and see how it fits your workflow.
This article is educational only and is not investment, tax or legal advice.