India VIX is NSE’s volatility index. It shows how much the Nifty 50 is expected to move over the next 30 days, based on Nifty option prices.
A higher VIX means the options market expects bigger swings, and a lower VIX means it expects calmer trading. It does not tell you which direction Nifty will move.
Create a free AlgoTest account to track India VIX next to the Nifty option chain and test how your strategy holds up when volatility jumps.
What Is India VIX?
Volatility means how much, and how fast, prices move. India VIX takes the prices traders are paying for Nifty options and turns them into one number that shows the size of move they expect.
It is often called the fear index because it usually rises when traders rush to buy protection, mostly put options, during a sell-off. When the market is calm and nobody is paying up for protection, it drifts lower.
Since it comes from option prices, India VIX is a form of implied volatility. Our guide to implied volatility and how to read it explains how option prices carry this expectation.
India VIX is non-directional. A reading of 25 says Nifty may swing sharply, but it does not say whether the swing will be up or down.
How Is India VIX Calculated?
NSE uses the method created by the Chicago Board Options Exchange (CBOE) for the US VIX, adapted for Nifty options. It takes the best bid and ask quotes of out-of-the-money calls and puts from the near and next-month Nifty expiries. It then blends them to cover a 30-day window.
In simple terms, the formula is:
India VIX = 100 × square root of the expected variance of Nifty over the next 30 days, stated on a yearly basis
A common myth is that India VIX uses the Black-Scholes model. It does not. The CBOE method is model-free: it reads expected volatility directly from a strip of option prices instead of running inputs through a pricing formula.
NSE publishes the full method and a white paper on its India VIX page if you want the maths in detail.
How to Read India VIX: Turn the Number Into a Nifty Range
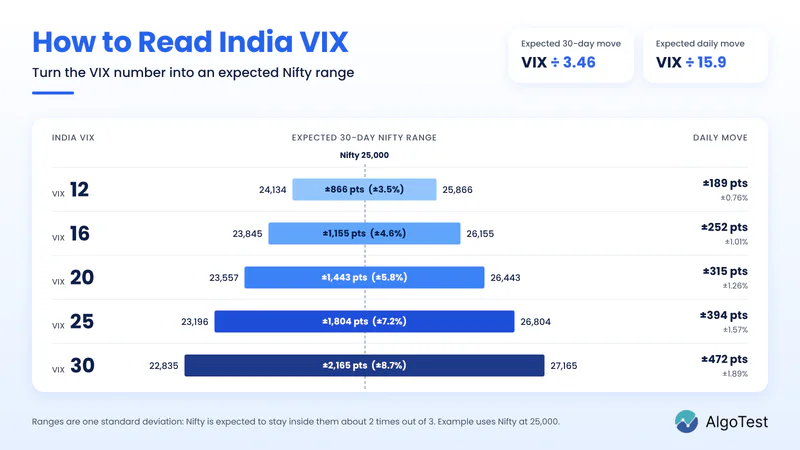
India VIX is a yearly number, so you need to convert it before it tells you anything useful about the next few weeks. Two quick rules do the job:
The expected 30-day move is roughly India VIX divided by 3.46 (the square root of 12).
The expected daily move is roughly India VIX divided by 15.9 (the square root of 252 trading days).
Here is what common VIX levels mean with Nifty at 25,000:
These ranges are one standard deviation. That means the options market expects Nifty to stay inside them about two times out of three. Bigger moves still happen, especially around surprise news.
A practical use is to compare these ranges with the strikes you are trading. Line them up against the live Nifty option chain and you can see whether a strike sits inside or outside the move the market is pricing.
What Is a High or Low India VIX?

Generic rules like “below 15 is low” leave out a lot. Daily closes since July 2010 give a clearer picture:
The median close is about 16.2, so half of all trading days closed below that level.
India VIX closed above 20 on about 24% of sessions.
It closed above 30 on under 3% of sessions.
The extremes show how wide the range can be. India VIX hit an intraday peak of about 92.5 in November 2008 and about 87 in March 2020. At the other end, it closed at a record low of 9.15 on 26 December 2025.
India VIX and Nifty: How They Move Together
India VIX and Nifty usually move in opposite directions. The link is strongest during sharp falls, when traders scramble for put options and push volatility up.
March 2020 is the clearest example. India VIX jumped from 25.20 to 64.40 as Nifty fell nearly 23%.
A more recent case came in March 2026. After the US-Iran conflict began, India VIX rose from 13.70 on 27 February to a 52-week high of about 28.9 by 30 March.
The inverse link is a tendency, not a rule. VIX can stay high during a rally driven by big news, and it often rises before known events like the Union Budget, RBI policy or election results, even if Nifty barely moves.
Related: Option Chain Analysis: How to Read OI, PCR and Max Pain
How Options Traders Use India VIX
When India VIX rises, call and put premiums usually rise together, because higher expected volatility makes every option worth more. The Greek that measures this is vega, covered in our guide to using option Greeks in trading.
To see it in action, open the AlgoTest Black-Scholes calculator, raise the volatility input and watch the premium change.
When India VIX is high
Option sellers collect bigger premiums, but the expected move is also bigger, so a single sharp day can wipe out weeks of collected premium.
Many sellers switch to defined-risk setups like an iron condor and trade fewer lots instead of selling naked straddles.
Option buyers pay more for the same strike, and if VIX falls after the event, premiums can drop even when the buyer gets the direction right.
When India VIX is low
Options are cheaper, so buyers pay less for the chance of a big move.
Sellers collect less premium for the same risk, and a sudden shock hurts more because few traders are hedged.
Around big events
India VIX often climbs into events like the Union Budget, RBI policy and election results, then falls once the news is out. Traders call this drop a volatility crush. It is the reason an option bought just before an event can lose value even after a big move.
For sizing and stop losses
The daily move column in the table above gives you a quick guide for stop distance. When VIX is high, a tight stop is more likely to get hit by normal noise, so many traders use wider stops with fewer lots. Our trading risk management guide shows how to set these rules.
Keep in mind that India VIX tracks Nifty only. Bank Nifty and stock options have their own implied volatility, so check the IV of the strike you are trading as well.
Replay a past high-VIX session in the AlgoTest Option Simulator and see how your premiums would have moved before you trade the next one.
Look Beyond the VIX Number: IVP, IVR and VRP
A VIX of 14 can be cheap or expensive. It depends on where volatility has been over the past year and how much Nifty is actually moving.
IV Percentile (IVP) and IV Rank (IVR) show where today’s implied volatility sits compared with its own past. AlgoTest’s IVR and IVP tool uses a constant 30-day IV and plots many symbols in a quadrant view. Read our guide on IV Percentile vs IV Rank to learn how to read the quadrants.
The volatility risk premium (VRP) is implied volatility minus realised volatility. If options are pricing more movement than Nifty is actually delivering, premiums are rich. AlgoTest’s VRP analysis dashboard tracks this gap. Our guide to implied vs realised volatility explains how traders use it.
Test Your Strategy in High and Low VIX Markets
A strategy that works when VIX is 11 can fall apart when it hits 25. Before you trust any setup, check how it behaves in both kinds of market.
AlgoTest lets you backtest options strategies on more than seven years of historical data, so you can test calm stretches and stressed ones like March 2020 and March 2026. Compare the drawdown and the worst day in each period. Our guide on how to backtest options strategies with examples walks you through it.
Where to Check India VIX Live
NSE’s India VIX page shows the live value along with historical data.
Most broker apps let you add India VIX to your watchlist.
On AlgoTest, India VIX appears right above the option chain in the Strategy Builder and the Option Simulator, along with its change for the day.
India VIX vs CBOE VIX
Both measure expected volatility over the next 30 days, so traders who follow global markets often watch them together.
Read the VIX, Then Test the Trade
India VIX tells you how big a move the options market is pricing, not which way Nifty will go. Use it as a starting point. Convert it into a Nifty range, compare it with IV percentile and realised volatility, size your trade to match, and then check how your strategy did when VIX was both low and high.
On AlgoTest, you can watch India VIX next to the option chain, read IVP and VRP, and backtest your idea across calm and volatile markets before you put money in.
Join us as we simplify options trading in India.
Related Reading
Put Call Ratio: Meaning, Formula, Nifty PCR and How to Use It
Nifty Expiry Day: 7 Rules Every Options Trader Should Follow
How to Choose an Option Selling Strategy Based on Market Conditions
FAQs
What is India VIX in simple words?
India VIX is a number that shows how much the options market expects Nifty to move over the next 30 days. A higher number means bigger expected swings, and a lower number means calmer markets.
What does an India VIX of 15 mean?
A VIX of 15 points to an expected Nifty move of about 4.3% over the next 30 days, either up or down. With Nifty at 25,000, that is roughly ±1,080 points. It sits a little below the long-run median of about 16.
Is a high India VIX good or bad?
It is neither. A high VIX means bigger price swings are expected. That makes options more expensive for buyers and gives sellers more premium but more risk.
Does India VIX predict market direction?
No. India VIX measures the expected size of a move, not its direction. It often rises when Nifty falls, but that is a tendency, not a forecast.
What is the highest India VIX ever?
India VIX hit an intraday peak of about 92.5 in November 2008 during the global financial crisis. In March 2020, during the COVID-19 crash, it touched about 87 intraday and closed at 83.61 on 24 March.
What is a normal India VIX level?
Since 2010, the median daily close has been about 16. Readings between 12 and 20 cover most normal market conditions.
Is India VIX calculated using the Black-Scholes model?
No. NSE uses the CBOE method, adapted for Nifty options. It reads expected volatility directly from the prices of out-of-the-money Nifty options instead of using a pricing model.