If you are new to the stock market, you may wonder: what is Nifty and Sensex, and why are both mentioned in market news?
Nifty and Sensex are benchmark stock market indices. They track the performance of a selected group of large Indian companies and provide a quick view of how the broader market is moving. Nifty 50 represents 50 companies listed on the National Stock Exchange, while Sensex represents 30 companies listed on the Bombay Stock Exchange.
Both indices serve a similar purpose, but they differ in their exchange, number of constituents, base values and derivatives contracts. This guide explains the Sensex and Nifty difference and also compares their options, expiry schedules, lot sizes and option chains.
What Is Nifty 50?
Nifty 50 is the benchmark index of the National Stock Exchange of India. The name combines “National Stock Exchange” and “Fifty,” referring to the 50 companies included in the index.
These companies come from major parts of the Indian economy, including financial services, information technology, energy, consumer goods, automobiles, healthcare and telecommunications. However, every company does not have the same influence on the index. Companies with a larger free-float market capitalisation generally receive a higher weight.
Free-float market capitalisation considers only the shares that are readily available for public trading. Promoter holdings and certain other strategic holdings are excluded from this calculation.
The Nifty 50 has a base date of November 3, 1995, and a base value of 1,000. According to the Nifty 50 factsheet, the index is calculated using the free-float market-capitalisation method and is rebalanced semi-annually.
Traders and investors use Nifty 50 to:
Understand the direction of the large-cap market
Compare the performance of portfolios and mutual funds
Invest through index funds and exchange-traded funds
Trade Nifty futures and options
Study market sentiment using charts and option-chain data
What Is Sensex?
Sensex is the benchmark index of BSE, formerly known as the Bombay Stock Exchange. The name is derived from “Sensitive Index.” It tracks 30 established companies from important areas of the Indian economy.
Sensex was launched on January 2, 1986. It has a base period of 1978–79 and a base value of 100. Like Nifty 50, it uses a free-float market-capitalisation approach. The BSE Sensex@40 white paper provides the history and development of the index.
Sensex is commonly used to:
Track the performance of large companies listed on BSE
Understand overall stock market direction
Compare investment and fund performance
Invest through Sensex index funds and ETFs
Trade BSE Sensex futures and options
So, what is Sensex and Nifty in simple terms? They are two different baskets of large Indian companies. Their values rise or fall according to the weighted price movement of the companies inside them.
You can use the Live SENSEX Option Chain to compare Call and Put strikes, OI, volume, premiums and other options data for the selected expiry.
Sensex vs Nifty
The main Sensex and Nifty difference is the exchange they represent and the number of companies they track. Nifty 50 represents 50 companies associated with NSE, whereas Sensex represents 30 companies associated with BSE.
Here is a quick Sensex vs Nifty comparison. The same factors also answer searches for Sensex vs Nifty 50 because Nifty generally refers to the Nifty 50 benchmark in this context.
*Expiry schedules and market lots are shown as of September 2026 and can be revised by the exchanges. Traders should verify the latest contract specifications before placing a trade.
Nifty has more constituent companies, so it provides a somewhat broader representation of the large-cap market. Sensex contains fewer companies and is more concentrated. However, both indices include many of India’s largest businesses, which is why their overall direction is often similar.
Related: Nifty Expiry Day: 7 Rules Every Options Trader Should Follow (2026)
How Are Nifty and Sensex Calculated?
Both indices use free-float market capitalisation, but their actual index values cannot be compared directly.
First, the market capitalisation of a company is calculated by multiplying its share price by the number of outstanding shares. A free-float factor is then applied to account for the shares that are available for public trading. The free-float market capitalisation of all index companies is combined and adjusted using the index divisor.
This methodology gives larger companies greater influence. For example, a 3% movement in a heavily weighted bank can affect an index more than the same movement in a company with a smaller weight.
The value of Sensex being numerically higher than Nifty does not mean Sensex is performing better. The indices started with different base values and on different base dates. Their point values therefore operate on different scales.
Related: Sensex Expiry Day: Date, Timing & 2026 Trading Guide
Why Do Sensex and Nifty Often Move Together?
Sensex and Nifty frequently move in the same direction because several large companies are common to both indices. Major banks, technology companies and other large businesses can carry considerable weight in each index.
Both indices also respond to many of the same market factors, including:
Corporate earnings
Interest-rate decisions
Inflation and economic growth
Foreign and domestic institutional flows
Crude oil and currency movements
Global equity market sentiment
Their daily percentage movements will not be identical because their constituent lists and stock weights are different. One index can outperform the other during a period when the sectors carrying more weight in that index perform particularly well.
Related: How to Analyze the Sensex Option Chain for Maximum Profitability
Sensex vs Nifty Returns: Which Has Performed Better?
There is no permanent winner in a Sensex vs Nifty returns comparison. Performance changes with the period selected and the sectors leading the market.
Nifty 50 has more companies and generally offers broader large-cap exposure. Sensex is more concentrated, so the movement of its largest constituents can have a greater effect on its returns. Even so, their long-term direction has often been similar because of the overlap between their largest companies.
When preparing a Sensex vs Nifty chart, compare percentage returns over identical dates rather than comparing index points. A useful method is to set both indices at a common starting value, such as 100, and then plot how that value changes. For a more complete investment comparison, use the total return versions of the indices because they account for dividends as well as price movement.
Investors should also remember that an index is a benchmark, not an investment recommendation. You cannot buy an index directly, but you can gain exposure through an index mutual fund or ETF designed to track it.
Related: Nifty Midcap 150: Complete Stocks List, Weightage, and Trading Guide (2026)
Nifty 50 vs Sensex for Options Trading
The Nifty 50 vs Sensex comparison is different for an options trader. Instead of looking only at constituent companies and past returns, traders must compare contract specifications and live market activity.
Nifty options trade on NSE with the symbol NIFTY. Sensex options trade on BSE with the SENSEX underlying. As of September 2026, Nifty weekly and monthly options expire on Tuesday, while Sensex weekly and monthly options expire on Thursday. The current Nifty market lot is 65, and the current Sensex lot is 20. These figures come from the latest available NSE Nifty contract specifications, NSE market-lot circular and BSE contract specifications.
A smaller lot size does not automatically make an options contract cheaper or less risky. The total exposure depends on the index level, option premium, number of lots, volatility and margin requirements.
Liquidity is another important difference. Instead of assuming that every Nifty or Sensex strike is liquid, check the selected expiry and strike directly. Focus on:
Change in open interest
Bid and ask prices
Bid-ask spread
Last traded price
A contract with a narrow bid-ask spread and consistent trading activity may be easier to enter and exit than a contract with a wide spread and low activity. Liquidity can also change across strikes and expiries during the same trading session.
Sensex Option Chain vs Nifty Option Chain
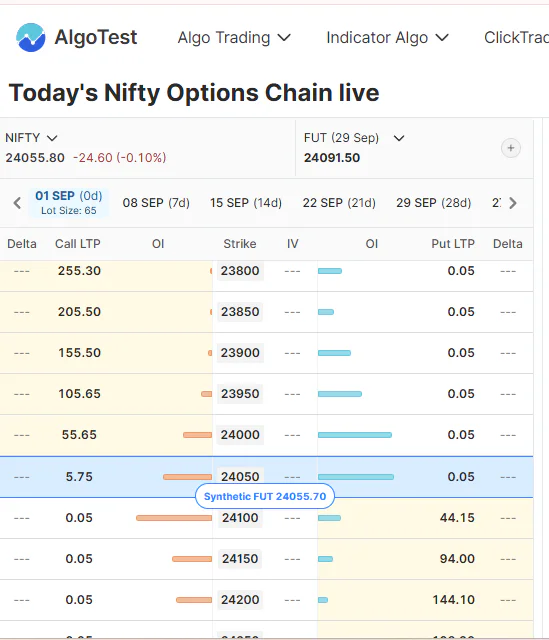
The structure of a Sensex Option Chain and a Nifty Option Chain is broadly similar. Both arrange Call and Put contracts around their strike prices and selected expiry dates. The main difference is the underlying index and the exchange on which the contracts are traded.
You can use an option chain to compare:
At-the-money, in-the-money and out-of-the-money strikes
Call and Put premiums
Volume and open interest
Change in OI
Implied volatility
Option Greeks
Liquidity across nearby strikes
Before selecting a contract, check the data for the exact index, expiry and strike you intend to trade. You can compare live Call and Put data using the Live Sensex Option Chain and Live Nifty Option Chain on AlgoTest.
Option-chain data should not be treated as a direct buy or sell signal. Open interest, volume and PCR can help explain market positioning, but they should be studied with price action, liquidity, volatility and risk-management rules.
Sensex or Nifty: Which Is Better?

The better index depends on what you are trying to do.
If you want a benchmark with more constituent companies, Nifty 50 provides broader large-cap coverage. If you want to follow a long-established basket of 30 major BSE-listed companies, Sensex serves that purpose.
For passive investing, compare the tracking error, expense ratio, liquidity and portfolio of the specific index fund or ETF rather than choosing only by the index name.
For options trading, compare live liquidity, available strikes, expiry schedules, lot size and bid-ask spreads. A trader may prefer one index for a particular strategy and the other for a different expiry or market condition. Neither index is automatically better for every investor or trader.
Test Your Nifty or SENSEX Options Strategy
Understanding the difference between Nifty and SENSEX is only the first step. Before trading either index, backtest your options strategy and study how it performed under different market conditions.
Get 25 free backtests every week on AlgoTest.