You may check NIFTY or SENSEX at 3:15 PM and assume that you are seeing the closing value. A few minutes later, you may find a different official close because eligible stocks enter the Closing Auction Session, also called CAS. During those minutes, the exchange publishes an indicative closing price, which is a live estimate of where the auction may settle.
You can follow this change on the AlgoTest CAS Trading Terminal, which was earlier called the Indicative Price Terminal.
Log in or sign up, go to Algo Trade from the dashboard, and open the CAS Trading Terminal. It shows where supported stocks and indices may close while CAS is running.
The terminal also keeps past sessions. Open the Historical CAS tab to see how the auction moved on any earlier trading day, not just today.
Track Live and Historical Indicative Closing Prices on AlgoTest
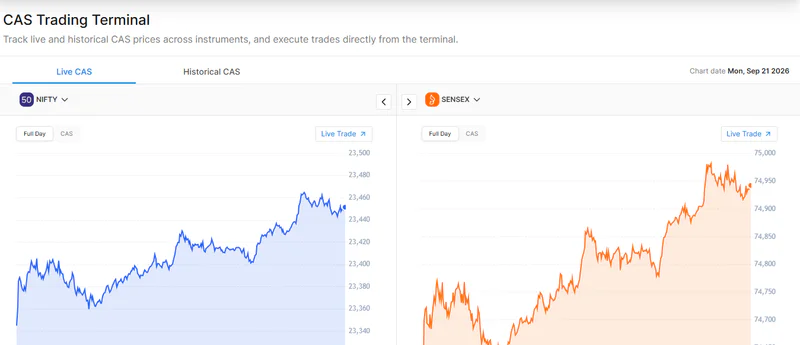
The terminal brings live and past CAS prices into one screen. You can track NIFTY 50, SENSEX, BANK NIFTY, MIDCPNIFTY, FINNIFTY, and eligible stocks.
Two instruments load next to each other, so you can watch NIFTY and SENSEX at the same time without switching screens.
For each supported instrument, you can:
Check its indicative closing price while the auction runs.
Check its spot last traded price, when available.
Compare the spot price with the indicative close.
Open a chart of how its price moved during the session.
Switch that chart between the full trading day and the CAS window alone.
Look up the same chart for an earlier date using the Historical CAS tab.
Place an order straight from the terminal using Live Trade.
You can also learn more about CAS here.
What Is the Indicative Closing Price
The indicative closing price is the price at which a stock may close if the auction ends at that moment.
It is a live estimate, not the confirmed closing price. It changes as people place, change, or cancel orders. The exchange confirms the final price after it closes order entry and matches eligible orders.
Suppose a stock stops regular trading at Rs 1,000 at 3:15 PM. Its indicative price may move to Rs 1,006 as new orders enter. It may move again before the final close is set.
This is why the last traded price and the official closing price may not be the same.
How Does CAS Work
CAS helps the exchange discover the closing price of eligible stocks. In the first phase, it applies to cash market stocks that have derivative contracts.
Under the current NSE Closing Auction Session rules, CAS runs from 3:15 PM to 3:35 PM.
3:15 PM to 3:20 PM. The exchange moves from regular trading to CAS and calculates the reference price. This reference price uses the volume weighted average price of trades from 3:00 PM to 3:15 PM.
3:20 PM to 3:25 PM. You can place, change, or cancel market and limit orders.
3:25 PM to 3:30 PM. You can place, change, or cancel only limit orders. The system closes order entry at a random time during the last two minutes.
3:30 PM to 3:35 PM. The exchange matches orders and confirms the closing price.
The exchange first looks for the price at which the highest number of shares can be traded. If more than one price meets this rule, it checks the unmatched order quantity. It may also check which price is closest to the reference price.
Check out: Nifty Expiry Day: 7 Rules Every Options Trader Should Follow (2026)
Why Is the Indicative Price Useful
The last traded price may pause during CAS, while the indicative price keeps changing with the auction order book. Tracking it helps you understand why the final close may differ from the value you saw at 3:15 PM.
You can also see whether the auction points to a higher or lower close. This may be useful on volatile days and expiry days, when a change in the closing index value can affect option positions.
How to Use the AlgoTest CAS Trading Terminal
Open the CAS Trading Terminal. NIFTY and SENSEX load side by side, which gives you a quick market view.
Use the instrument selector on either chart to switch to another index or stock.
Stay on the Live CAS tab to follow today's auction. Compare the indicative close with the spot price, then watch whether the expected close moves higher or lower as orders come in.
Use the Full Day and CAS buttons to change what the chart shows. Full Day plots the whole session. CAS plots only the closing auction window, which makes small moves easier to read.
When you want to act on what you see, use Live Trade to place the order without leaving the terminal.
For more clarity, watch the video!
Related: Sensex Expiry Day: Date, Timing & 2026 Trading Guide
How to Use Historical CAS Data
Live prices tell you what is happening now. Past sessions tell you what usually happens.
This is useful in a few ways.
You can check how far the close moved away from the 3:15 PM price on past days, which gives you a sense of a normal move.
You can study expiry days on their own, since the closing value matters more for option positions on those days.
You can look at event days, such as results or policy announcements, and see whether the auction moved more than usual.
You can compare a quiet day with a volatile day and see how different the two auctions look.
Over time this helps you judge whether today's auction is behaving normally, instead of guessing.
Find out if Backtesting is really helpful for traders!
What You Should Keep in Mind
The indicative price is not a guaranteed closing price. It can change until the order entry window ends. You should not use it as a standalone trading signal.
Use it to understand the closing auction and follow where the market may settle. Always wait for the exchange to confirm the final closing price before treating it as official.
Past sessions are also for study only. A pattern from earlier days does not promise the same move today.
Conclusion
The value you see at 3:15 PM is not always the value the exchange confirms. Watching the indicative price during CAS, and checking how past auctions behaved, helps you understand that gap instead of being surprised by it. Wait for the exchange to confirm the final price before you treat it as official.
The AlgoTest CAS Trading Terminal brings live CAS prices, past sessions, full day charts, and order placement into one screen. Register and start tracking supported stocks and indices today.