Most traders judge a strategy by its returns, win rate, or recent performance. But these numbers don't show how much the strategy lost before generating those returns.
Maximum Drawdown (MDD) measures the biggest decline in a strategy's value from its highest point before it recovers. It shows the worst phase a strategy has gone through historically and is one of the simplest ways to assess its risk.
Whether you're backtesting your own strategy, evaluating a Research Analyst's Algo, or reviewing a strategy before live deployment, maximum drawdown helps you understand what kind of losses you might have to sit through.
Before committing capital, ask yourself one question:
"Would I be comfortable if my portfolio dropped this much?"
If the answer is no, the strategy may not be the right fit, regardless of how attractive its returns look.
What is Maximum Drawdown?
Maximum Drawdown (MDD) is the largest decline in a strategy's value from its highest point (peak) to its lowest point (trough) before reaching a new peak.
Simply put, it measures the worst historical fall in your trading capital while following a strategy.
Example
Suppose your trading capital grows from ₹1,00,000 to ₹1,25,000.
After a period of market volatility, it falls to ₹1,10,000 before recovering.
Although you're still profitable overall, your maximum drawdown is:
₹15,000 (12%)
This tells you the largest temporary decline you would have experienced while following that strategy.
Generally:
Lower drawdown = Lower risk and a smoother trading experience.
Higher drawdown = Greater potential returns, but also larger temporary losses that require patience and discipline.
Learn more about Max Drawdown here
Max Loss Per Trade vs. Maximum Drawdown
Many traders confuse these two metrics, but they measure very different aspects of risk.
Max Loss Per Trade
The largest loss incurred on a single trade.
Maximum Drawdown
The largest cumulative decline in your trading capital across multiple trades.
Think of it like hiking:
One steep downhill section = Max Loss Per Trade
The longest downhill journey from the highest point to the lowest point = Maximum Drawdown
Example
Imagine:
Your biggest losing trade is ₹1,500.
Over five consecutive losing trades, your capital falls by ₹7,000 before recovering.
Your:
Max Loss Per Trade = ₹1,500
Maximum Drawdown = ₹7,000
While the largest losing trade may seem manageable, the cumulative decline is what tests both your finances and your psychology.
That's why professional traders pay much closer attention to drawdown than to individual losses.
Why Maximum Drawdown Is So Important
Maximum drawdown tells you something that returns never can:
How painful the trading journey could become before it gets better.
It helps answer practical questions such as:
Can I emotionally handle this strategy?
Is my capital sufficient?
How much should I allocate?
Will I continue trading if this drawdown occurs?
Two strategies might generate similar returns but have completely different risk profiles.
Although Strategy A generates higher returns, many traders would prefer Strategy B because it offers a much smoother trading experience with significantly lower downside risk.
This is why experienced traders evaluate risk-adjusted returns, not just absolute profits.
Related: Learn how to create strategies on AlgoTest Strategy Builder
Why Most Retail Traders Ignore Maximum Drawdown
Retail traders often evaluate strategies based on:
Monthly profits
Win rate
CAGR
Recent performance
Number of winning trades
But very few ask:
How much did this strategy lose during difficult market conditions?
How long did recovery take?
Can I survive ten consecutive losing sessions?
Will I panic if my capital falls by 15%?
Ignoring maximum drawdown often leads to:
Exiting strategies after temporary losses
Overleveraging positions
Allocating excessive capital to one strategy
Chasing recent winners instead of consistent performers
Simply put:
You should understand the worst historical phase before risking your capital.
Related: Difference between backtesting, forward testing and live trading on RA Algos
How AlgoTest Helps You Analyze Maximum Drawdown
AlgoTest makes it easy to evaluate trading strategies using detailed performance analytics across its products.
Whether you're:
Backtesting an options strategy
Forward Testing before deploying real capital
Building strategies using the Strategy Builder
Managing multiple strategies through Portfolios
Exploring RA Algos
You can easily analyze maximum drawdown alongside other important performance metrics.
What are RA Algos?
RA Algos are ready-to-deploy algorithmic trading strategies created by SEBI-registered Research Analysts and available on AlgoTest.
Instead of building a strategy from scratch, traders can explore professionally developed strategies, review their historical performance, understand their risk characteristics, and deploy them through supported brokers.
Each RA Algo includes transparent performance metrics such as:
Net Profit
CAGR
Win Rate
Maximum Drawdown
Equity Curve
Drawdown History
This allows traders to compare strategies based on both returns and risk, rather than choosing solely on profitability.
How AlgoTest Displays Maximum Drawdown
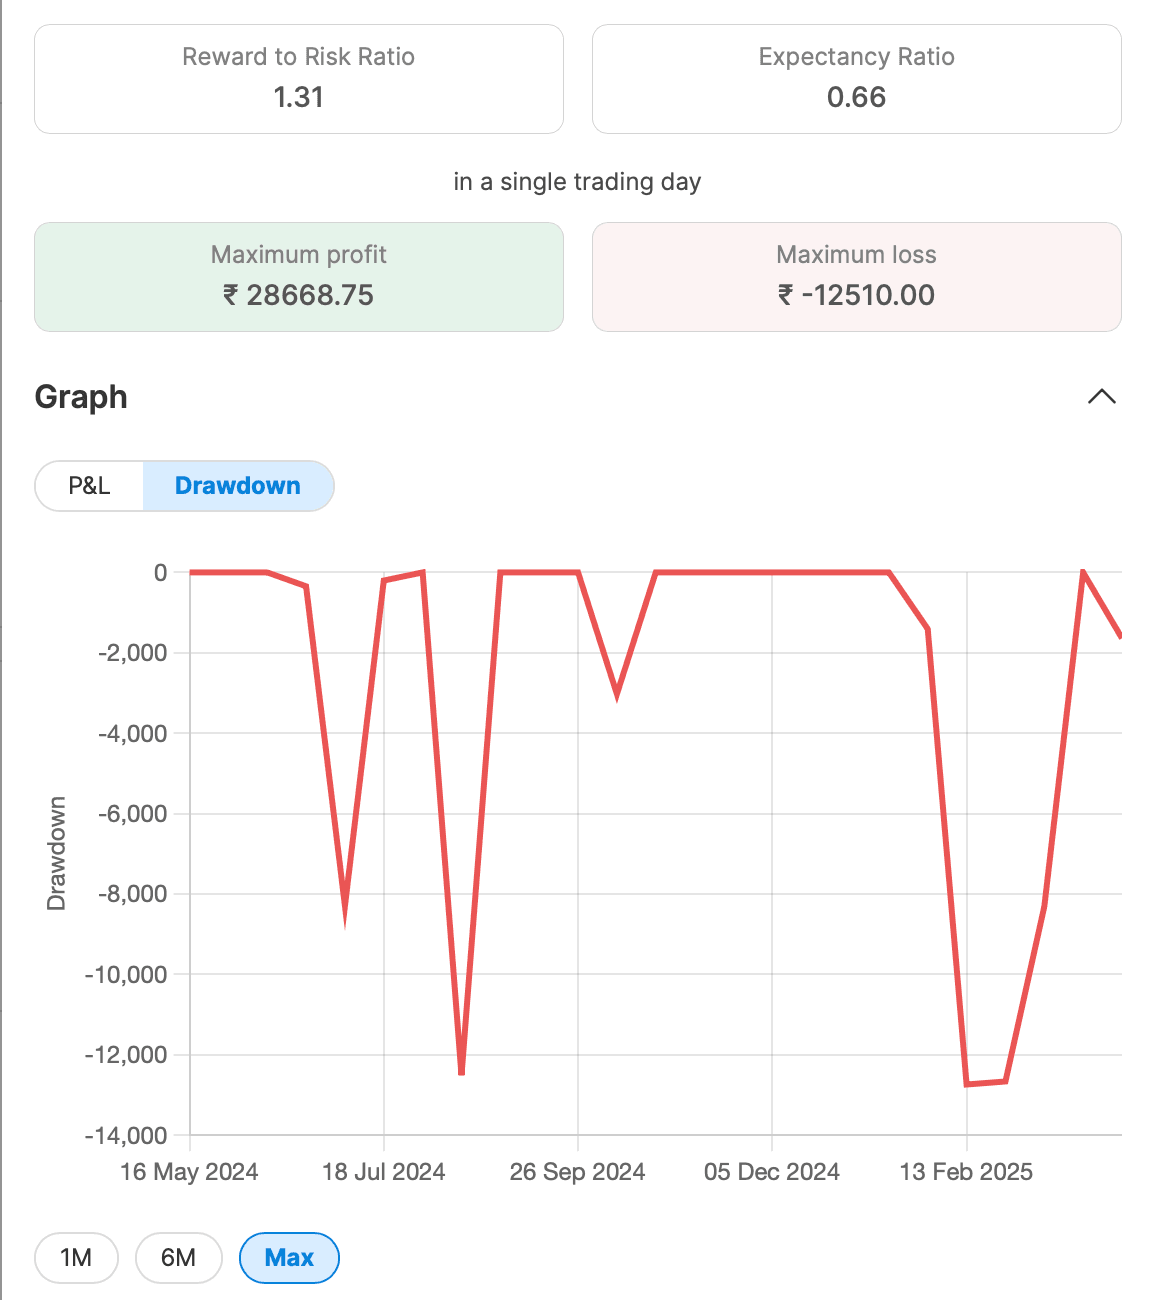
Backtest Summary
Every strategy on AlgoTest includes a detailed performance summary showing:
Maximum Drawdown (%)
Maximum Drawdown (₹)
Net Profit
Win Rate
CAGR
Risk-related metrics
This makes it easy to compare multiple strategies before deployment.
Equity Curve
The Equity Curve visually shows:
Growth phases
Recovery periods
Market corrections
Drawdowns between equity peaks
Rather than only looking at the final profit figure, traders can understand how consistently the strategy performed over time.
Drawdown Graph
AlgoTest also provides a dedicated Drawdown Graph that highlights:
Consecutive losing periods
Drawdown depth
Recovery duration
This helps traders understand whether losses were:
Frequent
Short-lived
Extended
Deep
Realistic Backtesting
One of the biggest advantages of AlgoTest is that historical performance includes:
Brokerage
Slippage
Transaction costs
This produces a far more realistic estimate of historical drawdowns than simplified backtests that ignore execution costs.
While future performance can never be guaranteed, understanding realistic historical drawdowns leads to better-informed trading decisions.
Deep dive on What RA Algos are on AlgoTest
Combine Backtesting with Forward Testing
Historical performance is valuable, but markets constantly evolve.
That's why many traders use Forward Testing after Backtesting and before Live Execution.
Forward Testing helps you:
Validate strategies in live market conditions
Compare live drawdowns with historical ones
Observe execution quality
Build confidence before deploying larger capital
Using both Backtesting and Forward Testing creates a much stronger risk management process than relying on historical data alone.
How to Use Maximum Drawdown to Build Better Portfolios
1. Match Drawdown with Your Risk Tolerance
If a strategy has historically experienced a 10% drawdown, ask yourself:
Would I continue following this strategy if my capital fell by 10%?
If not:
Reduce your allocation.
Choose a lower-risk strategy.
Diversify your capital.
2. Diversify Across Strategies
Avoid allocating all your capital to one strategy.
Instead, combine strategies with different market behaviours, such as:
Trend-following strategies
Mean-reversion strategies
Volatility-based strategies
Intraday options strategies
AlgoTest's Portfolio feature allows traders to evaluate multiple strategies together and build a more balanced portfolio.
Diversification often reduces overall portfolio drawdown.
3. Size Positions Properly
Strategies with larger drawdowns should generally receive smaller allocations.
Instead of investing your entire capital into one aggressive strategy, consider spreading it across multiple strategies with different risk profiles.
Proper position sizing helps reduce overall portfolio volatility.
4. Prepare Yourself Mentally
Even profitable strategies experience losing periods.
A strategy with a historical:
6% drawdown
may eventually experience:
8%
10%
or even higher
Markets are dynamic, and no strategy is immune to difficult phases.
Many experienced traders keep a 1.5× to 2× buffer over the historical maximum drawdown when planning their capital and expectations.
5. Don't Chase Returns Alone
The highest-return strategy isn't always the best choice.
Instead, compare:
Returns
Maximum Drawdown
Recovery Time
Consistency
Win Rate
A strategy with slightly lower returns but significantly lower drawdowns is often easier to stick with over the long term.
Common Mistakes Traders Make
Many traders unknowingly increase their risk by:
Ignoring drawdown altogether
Allocating capital based only on recent returns
Increasing position size after profitable periods
Exiting during temporary drawdowns
Running multiple highly correlated strategies
Evaluating drawdown before investing helps avoid these common mistakes.
Conclusion: Respect the Drawdown
Maximum Drawdown isn't just another statistic on a performance report.
It's one of the clearest indicators of the real risk involved in a trading strategy.
When evaluating strategies on AlgoTest, whether you're using Backtesting, Forward Testing, Strategy Builder, Portfolios, or exploring RA Algos, don't focus only on profits.
Instead:
Evaluate the maximum drawdown.
Understand the recovery period.
Compare risk with returns.
Diversify your portfolio.
Validate strategies through Forward Testing before Live Execution.
Remember:
Returns tell you how much a strategy earned. Maximum drawdown tells you what it took to earn those returns.
Successful trading isn't about avoiding losses, it's about understanding, managing, and preparing for them.
AlgoTest equips traders with institutional-grade analytics, transparent backtests, realistic cost assumptions, and comprehensive performance metrics so they can make informed, data-driven trading decisions.
Join us as we simplify algo trading in India for retail traders.
Disclaimer: Historical drawdowns do not guarantee future performance. Market conditions change, and future drawdowns may exceed historical levels. Always diversify your investments, manage position sizing carefully, and trade only with capital you can afford to risk.