Best Indicator for Options Trading: A Practical, Strategy-First Guide
Options trading is exciting, but it’s a double-edged sword. If you don't have a system, the market will wipe your account faster than you can click "Buy."
The hard truth? Picking the right direction is only 30% of the battle. To be a profitable trader in the Indian markets (Nifty, BankNifty, or Equity Options), you must master Timing and Volatility.
Here we explain the best indicators for options trading simply, so you can actually use them.
First, Why Do Options Need Special Indicators?
When you trade stocks, you only need to ask one question: Will the price go up or down?
Options are trickier. You need to get three things right:
Direction — will the stock move the way I think?
Timing — will it move before my option expires?
Premium — am I paying a fair price for this option?
Miss even one of these, and you can lose money — even if you were right about the direction.
That's why standard stock indicators don't always cut it for options.
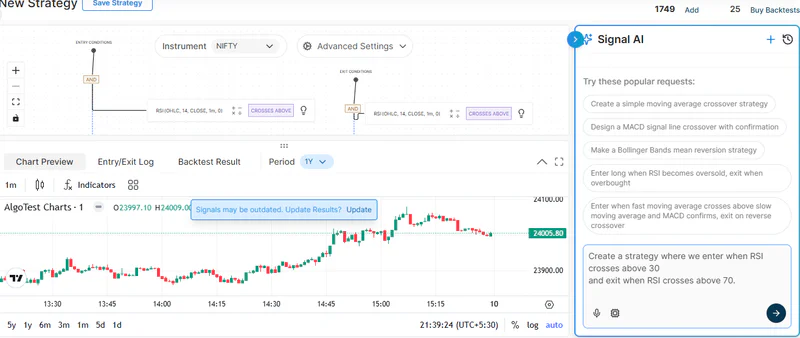
Signals AI on AlgoTest is an indicator-based strategy builder that allows users to create, backtest, Algo Trade and forward test indicator-based strategies without writing any code.
The Two Types of Options Indicators
Before we dive in, here's a simple framework:
Bucket 1: Price & Momentum Indicators. These help you figure out direction. → RSI, MACD, Moving Averages, Bollinger Bands
Bucket 2: Options-Specific Indicators. These help you understand premiums and market positioning. → Implied Volatility, Put-Call Ratio, Open Interest, Option Chain
The best traders use both. One without the other gives you an incomplete picture.
The Best Indicators for Options Trading
1. RSI (Relative Strength Index)
RSI is probably the most beginner-friendly indicator out there.
It measures how fast and how strongly a stock's price is moving — on a scale of 0 to 100.
Here's how to read it:
RSI above 70 → stock is overbought → price may reverse down → look at puts
RSI below 30 → stock is oversold → price may bounce up → look at calls
RSI is great for timing. It tells you when to enter, not just what to trade.
Pro tip: Don't jump in the moment RSI hits 70 or 30. Wait for it to cross back out of that zone — that's your actual signal.
2. Bollinger Bands
Volatility is everything in options. Bollinger Bands measure it beautifully.
The bands expand when volatility is high. They squeeze together when volatility is low.
Here's what that means for you:
Bands squeezing tight → a big move is coming → good time to buy straddles or strangles
Bands expanding wide → volatility is already high → better time to sell options
Also, watch the price action around the bands:
Price touching the upper band → possibly overbought
Price touching the lower band → possibly oversold
Simple. Visual. Useful.
Related: 7 Bollinger Bands Strategies for Indian Markets
3. Implied Volatility (IV)
This is the most important options-specific indicator. Full stop.
IV tells you how expensive or cheap an option is right now.
High IV = options are expensive → better to sell options and collect premium
Low IV = options are cheap → better to buy options
Here's the costly mistake many traders make they buy options right before a big event (like earnings or RBI policy) when IV is sky-high. The stock moves in their favour, but the premium crashes anyway because IV drops after the event.
Always check IV before you buy an option. Always.
4. Intraday Momentum Index (IMI)
Not many traders know about this one, which is exactly why it's worth learning.
IMI is similar to RSI, but built specifically for intraday trading. It combines candlestick patterns with momentum signals.
Like RSI:
IMI above 70 → overbought
IMI below 30 → oversold
The key difference? IMI uses intraday price data, making it sharper and faster for same-day option trades. If you do a lot of intraday options, add this to your toolkit.
5. Money Flow Index (MFI)
Think of MFI as RSI's smarter cousin because it also considers volume.
It measures the flow of money in and out of a stock over a set period. More volume + price rise = strong buying pressure. Less volume = weak move.
Reading MFI:
Above 80 → overbought
Below 20 → oversold
MFI is especially useful for stock options (not just index options like Nifty/BankNifty). When volume backs up the price move, you get a much more reliable signal.
6. Put-Call Ratio (PCR)
PCR is your market mood meter.
It compares how many puts vs. calls are being traded.
PCR above 1 → more puts being bought → market is bearish
PCR below 1 → more calls being bought → market is bullish
Extreme readings → often signal a reversal (everyone on one side is usually wrong)
Some traders actually use PCR as a contrarian indicator. When too many people are bearish, they look for a bounce, and vice versa.
Use PCR as context before entering any trade.
7. Open Interest (OI)
Open Interest tells you how many active contracts exist at a given strike price.
It doesn't tell you the direction. But it tells you strength.
Here's a simple OI cheat sheet:
Also, check the option chain for OI concentration:
Highest Call OI at a strike → that strike acts as resistance
Highest Put OI at a strike → that strike acts as support
This is incredibly useful around weekly expiry days.
Check out the best Paper trading apps for Indicator algo strategies
8. MACD (Moving Average Convergence Divergence)
MACD shows you momentum shifts using two moving averages.
Watch for crossovers:
MACD line crosses above signal line → bullish momentum → call setups
MACD line crosses below signal line → bearish momentum → put setups
Also watch the histogram — the bars between the lines:
Bars shrinking → momentum fading → don't enter new trades in that direction
Bars growing → momentum building → trend is strong
MACD works best for positional options trades held for 1–5 days. Less useful for intraday.
9. Moving Averages (EMA & SMA)
Moving averages are the foundation of trend trading.
Two types to know:
EMA (Exponential MA) — reacts faster to recent price changes. Better for short-term trades.
SMA (Simple MA) — smoother, slower. Better for identifying the overall trend.
How to use them for options:
Price above the 20 or 50 EMA → bullish bias → lean toward calls
Price below the 20 or 50 EMA → bearish bias → lean toward puts
When price crosses a key EMA with strong volume — that's a meaningful signal.
Related: EMA Indicator Strategy: How to Automate It Without Coding
How to Combine These Indicators
The thing is that no single indicator is perfect. They all give false signals sometimes.
The trick is using 2–3 complementary indicators together.
For buying calls or puts: RSI (time your entry) + MACD (confirm direction) + IV (make sure premium isn't expensive)
For straddles or strangles: Bollinger Band squeeze (spot the compression) + IV Rank (confirm premiums are cheap) + OI (find key strikes)
For selling options: High IV (premiums are rich) + PCR (read the sentiment) + Option Chain OI (pick your strikes)
For intraday options: IMI or RSI (entry timing) + OI change (confirm direction) + MFI (check if volume supports the move)
3 Mistakes to Avoid while Choosing an Indicator in Trading
1. Using only one indicator No indicator is always right. Markets change. Layer your signals.
2. Buying options with high IV If IV is elevated, you're paying a premium for a premium. After the event, IV crashes, and so does your option, even if the price moved your way.
3. Ignoring the calendar Earnings reports, RBI announcements, and budget days these spike IV before the event and crush it right after. Know what's coming.
Quick Cheat Sheet
Wrapping Up
Options trading isn't just about being right. It's about being right on direction, timing, and premium, all at once.
Start small:
Learn RSI and Bollinger Bands first
Then add Implied Volatility to every trade
Check the Option Chain each morning for key levels
Once you're comfortable, layer in OI, PCR, and MACD.
The goal isn't to use every indicator. The goal is to find 2–3 that work with your style — and use them consistently.
That's how profitable options traders are built.
Disclaimer: This article is for educational purposes only and should not be considered investment advice. Options trading involves significant risk. Please consult a SEBI-registered advisor before trading.