Sensex Option Chain Explained: How to Read, Analyse & Trade Using Live Data
What is Sensex Option Chain?
The Sensex option chain is a table showing all available call and put options, including strike price, open interest, volume, and implied volatility.
Whether you're using the Sensex option chain live or analysing past data, traders use it to identify market sentiment, support, resistance, and trading opportunities.
You can also track the BSE Sensex option chain in real time to understand how positions are building across strike prices.
https://algotest.in/sensex-option-chain
Let's take a look at how to trade in Sensex, how to read the Sensex option chain, and how to use it in trading.
Sensex Option Chain Table & Data Overview
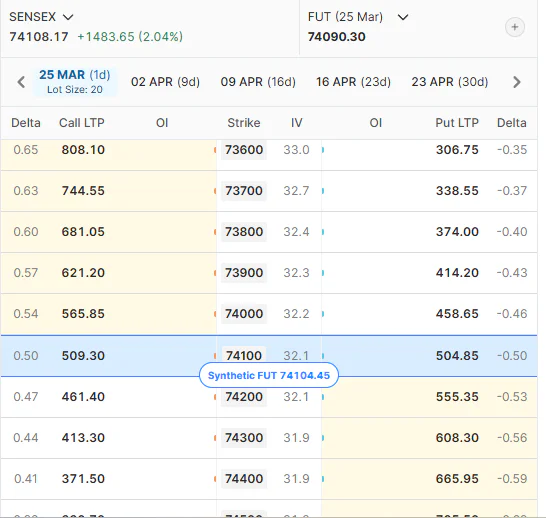
The Sensex option chain includes key data points such as:
This data helps traders perform Sensex option chain analysis to compare contracts, understand market sentiment, and plan trades more effectively.
Key Components of Sensex Option Chain
Understanding these components is essential before using any option chain trading strategy.
Strike Price
This is the price at which you can buy or sell the Sensex. Multiple strike prices are available for each expiry.
Premium
This is the price paid by the buyer to the seller. It changes based on time, volatility, and market movement. The option chain also shows bid and ask prices.
Open Interest (OI)
This shows how many contracts are currently active at a strike price. High OI indicates strong participation and can act as a potential support or resistance zone. It does not guarantee price movement.
Track the Sensex option chain live and validate setups here:
https://algotest.in/sensex-option-chain
Volume
This shows how many contracts are traded during the day. It helps you understand activity and interest at a specific level.
Implied Volatility (IV)
This reflects expected market movement. High IV means higher expected movement and higher premiums. Low IV suggests relatively stable conditions.
Read more about volatility here: Understanding Volatility
How to Read BSE Sensex Option Chain (Step-by-Step)
To effectively use the Sensex option chain, follow this structured approach:
Identify the ATM (At-The-Money) strike
Compare Call vs Put Open Interest
Track Change in OI (COI)
Observe volume spikes
Analyse implied volatility (IV)
This helps you understand whether the market is bullish, bearish, or range-bound.
Related: How to Read Nifty Option Chain Like a Pro (with Live OI Example
Sensex Option Chain Analysis Today (Example)
Let’s understand how traders use Sensex option chain analysis today:
Current Sensex level: Near ATM strike
Highest Call OI → Potential resistance
Highest Put OI → Potential support
Interpretation:
Market likely to trade within a range
Suitable strategy: Credit spread / Iron condor
Track live data and validate setups here:
https://algotest.in/sensex-option-chain
Related: How to Use Option Greeks in Trading: A Practical Guide for Options Traders
Trading Use Cases of Sensex Option Chain
This is where option chain analysis becomes powerful.
1. Identifying Support and Resistance
High Put OI → Strong support
High Call OI → Strong resistance
This helps traders plan entries and exits.
2. Intraday Trading Using Option Chain
For intraday option chain strategy:
Track OI shifts in real time
Watch price breakout near high OI levels
Confirm with volume
Useful for scalping and short-term trades
3. Expiry Day Trading Strategy
On expiry:
Monitor max pain level
Track OI unwinding
Expect volatility spikes
Helps in weekly expiry option chain analysis
4. Strategy Building Using Option Chain
Traders use option chain data to build:
Credit spreads
Iron condors
Straddles and strangles
Avoid random trades—use structured strategies
Related: Option Strategy Builder: Build, Test & Optimize Winning Trades with AlgoTest
Understanding ITM, ATM, and OTM
ITM (In-The-Money)
Higher probability, higher premium
ATM (At-The-Money)
Balanced risk and reward
OTM (Out-of-The-Money)
Cheaper but requires strong movement
Option Greeks
Delta
Shows how much the option premium changes with price movement.
Theta
Represents time decay and shows how much the value reduces as expiry approaches.
Vega
Shows how changes in volatility impact the premium.
Gamma
Shows how quickly delta changes. It is usually highest near ATM, especially close to expiry.
Learn more about Greeks here: Greeks interactions in options trading
https://algotest.in/sensex-option-chain
PCR and Max Pain in Option Chain
Put Call Ratio (PCR)
PCR = Put OI / Call OI
Above 1 → Bullish bias
Below 1 → Bearish bias
Max Pain
The level where option sellers face minimum loss.
Price may gravitate toward this level near expiry
Read More: Undеrstanding thе Put Call Ratio: A Kеy Indicator for Options Tradеrs
How to Trade Using Sensex Option Chain
Follow this structured approach:
1. Define your market view
Bullish / Bearish / Neutral
2. Select expiry
Weekly for short-term, monthly for positional
3. Choose strike
ATM for beginners, ITM for safer trades
4. Use strategies
Avoid random buying/selling
5. Monitor continuously
Track price + OI together
Validate your trades with Sensex option chain live data:
https://algotest.in/sensex-option-chain
Sensex vs Nifty Option Chain
Choose based on your trading style and capital
Access Historical Option Chain Data on AlgoTest
With AlgoTest’s Options Simulator, you can access historical option chain data and backtest your strategies using real market conditions.
Explore historical option chain for:
Analyze past data, validate your strategies, and trade with confidence.
Conclusion
The Sensex option chain is a practical tool to understand market positioning and potential price levels.
However, it should not be used in isolation. Combine it with price action, trend, and risk management for better results.
To move from learning to execution:
Sign up now and get 25 backtests free.
Start with the basics. Focus on open interest, change in open interest, and clear setups. This alone can significantly improve your trading decisions.