How to Read Nifty Option Chain Like a Pro (with Live OI Example)
What is the Nifty Option Chain?
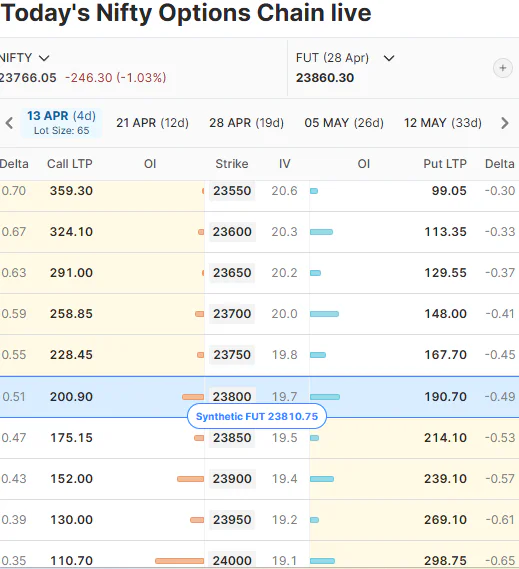
The Nifty Option Chain is a structured table that displays all available call and put option contracts for the Nifty index. It includes key metrics such as open interest (OI), implied volatility (IV), and last traded price, helping traders analyze market sentiment and identify potential support and resistance levels.
Analyzing the Nifty Option Chain is a fundamental skill for any options trader. While the raw data on the NSE website is a good starting point, a professional setup requires a more structured approach to turn those numbers into a trading plan.
Sign up and check out the specialized tools available on AlgoTest.
Check Live Nifty Option Chain
Most traders begin by analyzing the option chain directly on the National Stock Exchange of India (NSE) website, where live data for all Nifty strikes is available.
However, raw option chain tables can be difficult to interpret, especially when you're trying to quickly identify trends, OI shifts, or market sentiment.
This is where AlgoTest provides an edge. Instead of manually scanning rows of data, you can:
Visualize Open Interest (OI) clusters instantly
Track changes in market positioning in real time
Analyze option Greeks directly within the chain
This allows you to move from data reading → decision making much faster.
Access live Nifty option chain instantly on AlgoTest with OI visualization and Greeks.
NSE vs AlgoTest Option Chain
1. What is the Nifty Option Chain?
An option chain is a comprehensive matrix of all available option contracts for Nifty. It lists strike prices with their corresponding Call and Put data. For a trader, the option chain is the "order book" of the market, revealing where big institutions are placing their bets.
2. Essential Data Points to Track
To analyze the Nifty chain effectively on AlgoTest, you must focus on these five key metrics:
Strike Price: The "anchor" of the contract. In Nifty, these are typically spaced at 50-point intervals.
LTP (Last Traded Price): The current premium. Monitoring how premiums decay (Theta) or spike (Vega) is crucial for timing entries.
Open Interest (OI): The total number of open contracts. High OI at a strike suggests a strong conviction level from option writers.
Change in OI: This indicates whether new positions were created or old ones were closed during the current session. It is the best indicator of intraday momentum.
Implied Volatility (IV): This tells you how "expensive" or "cheap" options are. High IV usually precedes a big move or suggests an upcoming event (like RBI policy or earnings).
Related: How to use Option Greeks in Trading
3. Identifying Market Range: Support & Resistance
In option chain analysis, we generally follow the "Seller’s Perspective." Since option selling requires more capital, it is dominated by institutional players who are often right.
Resistance: The Call strike with the highest Open Interest. This is the ceiling where sellers are betting Nifty will not cross.
Support: The Put strike with the highest Open Interest. This is the floor where sellers are betting Nifty will stay above.
Related: How to analyse and trade strategies using historical option chain on AlgoTest simulator
The AlgoTest Advantage
Instead of manually scanning tables, you can use the AlgoTest Strategy Builder to:
Spot institutional positions instantly using OI clusters and real-time data visualization.
It visualizes these OI clusters, allowing you to see "OI Walls" instantly. When Nifty approaches a high-OI Call strike, expect a price rejection or a sideways move.
4. Advanced Sentiment Indicators
The Put-Call Ratio (PCR)
The PCR is a quick health check for the market. It is calculated by dividing total Put OI by total Call OI.
PCR > 1.0: Bullish (More Puts being written)
PCR < 0.7: Bearish (More Calls being written)
PCR > 1.6 or < 0.5: Extreme sentiment, often indicating a potential reversal
Max Pain Theory
Max Pain is the strike price where the most option buyers will lose money upon expiration.
On AlgoTest, tracking the Max Pain point helps you identify the "magnetic" level toward which Nifty is likely to gravitate as expiry approaches.
Related: Nifty Lot Size Explained
5. Reading Option Greeks on the Chain
Unlike basic tables, the AlgoTest Option Chain integrates Greeks directly into the view.
Delta: Tells you how much the premium will move for every 1-point move in Nifty.
Theta: Shows you the "rent" you pay (as a buyer) or collect (as a seller) for holding the position overnight.
Gamma: Essential for expiry day trading; it tracks how fast the Delta changes.
Also Read: How to Backtest Options Strategies
6. How to Trade Nifty Options Using the Chain
Define the Range: Use the Max OI strikes to find your boundaries.
Check Momentum: Look at the Change in OI. If Call OI is decreasing while Put OI is increasing at the same strike, it's a "Short Covering" rally—a very bullish sign.
Select the Right Strike:
Intraday: Focus on At-the-Money (ATM) or slightly Out-of-the-Money (OTM) for higher liquidity
Positional: Consider In-the-Money (ITM) options to minimize time decay
Simulate and Backtest:
Backtest your option chain analysis before risking capital with the AlgoTest Simulator.
You can "replay" the option chain from previous days to see if your thesis would have worked in a live-market scenario.
Related: Best Paper Trading Websites in India
Example: Nifty Option Chain Analysis (Real Scenario)
Let’s say Nifty is currently trading at 22,000. Here’s how a trader would analyze the option chain step by step:
Highest Call OI → 22,200 (Resistance):
Heavy Call writing at this level indicates strong resistance. Option sellers are betting that Nifty will not cross 22,200 before expiry.Highest Put OI → 21,800 (Support):
Strong Put writing suggests that traders expect the market to hold above 21,800, making it a key support zone.PCR (Put-Call Ratio) → 1.2 (Bullish Bias):
A PCR above 1 signals that more Puts are being written than Calls, indicating a mildly bullish sentiment.
The Verdict
The market is likely to remain in the 21,800–22,200 range, with a bullish bias.
A breakout above 22,200 could trigger short covering, while a breakdown below 21,800 may lead to sharp selling.
Related: How to Read Sensex Option Chain
How to Read Nifty Option Chain (Quick Steps)
Identify highest Call OI → Resistance
Identify highest Put OI → Support
Check Change in OI → Momentum
Analyze PCR → Market sentiment
Confirm with price action
Also Read: Understanding straddle charts
Check out our documentation to learn about options trading and get the most out of AlgoTest's products and features.
Conclusion
Reading the Nifty Option Chain is about connecting price, volume, and time. With AlgoTest, you go beyond raw data using real-time Greeks, OI insights, and backtesting tools.
Ready to act on your analysis?
Spot institutional positions and validate your trades before risking real capital.
Get 25 free backtests and see how your strategy performs in real market conditions