Implied Volatility Explained: How to Read and Compute IV
What is Implied Volatility?
Implied Volatility (IV) is a forward-looking metric that represents the market's expectation of the magnitude of future price changes for an underlying asset (like a stock) over a specific period.
Volatility is one of the most critical inputs in options pricing models, such as the Black-Scholes model - however no one knows what the true volatility of the underlying asset will be. If you knew this in advance, you’d be a billionaire. So, we use implied volatility instead.
Unlike realized volatility (historical volatility), which measures how much an asset's price has fluctuated in the past, IV is derived from the current market price of an option. It is the volatility level that, when plugged into an options pricing model, yields a theoretical option price equal to the current market price.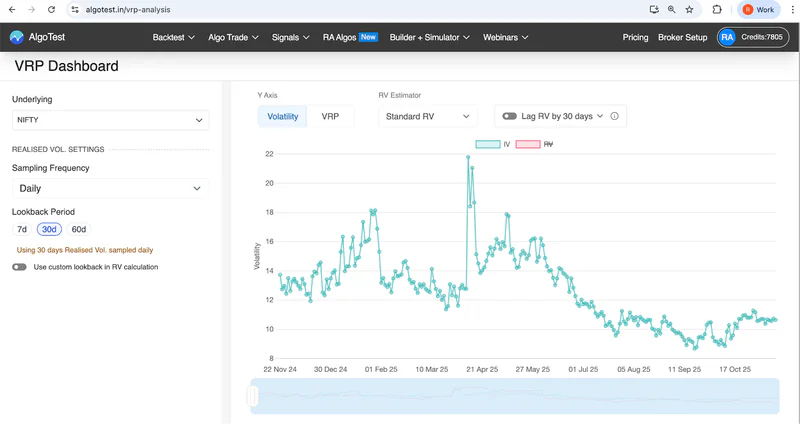
30d IV of NIFTY over the date 22nd Nov 2024 and 19th Nov 2025. This graph is taken from VRP analysis tool.
Key Takeaways:
Forward-Looking: IV is a forecast of future volatility, not a measure of past volatility - its the markets best estimate of how volatile the market thinks the underlying will be over the life of the option
Market-Driven: It is derived from the supply and demand dynamics in the options market.
Expressed as an Annualized Percentage: IV is typically quoted as an annualized percentage, representing a one standard deviation move in the underlying asset's price over the next year.
Related: How to Use Option Greeks in Trading: A Practical Guide for Options Traders
How to Interpret Implied Volatility
Implied volatility is directly correlated with the price of an option:
A high IV suggests the market anticipates significant news, an earnings announcement, or a major event that could cause a large price swing like covid, war or events like Trump increasing tariff. A low IV suggests the market expects the price to remain relatively stable.
The spike shown in the graph is from the time when China announced retaliatory tariffs to Trump's original tariffs in April 2025. You can check it yourself on VRP analysis tool.
Computing Implied Volatility
Implied volatility cannot be calculated directly using a simple formula. Instead, it is computed by working backward from the current market price of an option using an options pricing model, most commonly the Black-Scholes Model.
The Black-Scholes model requires five inputs to calculate an option's theoretical price:
Current Stock Price
Strike Price
Time to Expiration
Risk-Free Interest Rate
Volatility (the unknown variable)

Since the market price of the option is known, the process involves an iterative, trial-and-error method:
Start with an estimate for the volatility.
Plug the estimate and the other four known inputs into the Black-Scholes formula to calculate a theoretical option price.
Compare the theoretical price to the actual market price.
Adjust the volatility estimate (up if the theoretical price is too low, down if it's too high).
Repeat this process until the theoretical price matches the market price.
Raghav goes over this in his course - check Volatility Course
The final volatility value that makes the model's price equal to the market price is the Implied Volatility (IV). We have to go through this iterative process to estimate the IV since a closed-form solution does not exist.
Moneyness and Implied Volatility
The implied volatility of an option is not constant across all strike prices for the same expiration date. This variation is known as the Volatility Skew or Volatility Smile. The relationship between an option's moneyness and its IV is a key component of this skew.
The general observation in equity markets is that OTM put options (lower strikes) have higher IVs than ATM options. This is because traders are willing to pay a higher premium for protection against a sharp market decline, which is reflected in the price (and thus the IV) of OTM puts.
You can check out the current IV of RELIANCE options here.
Volatility Structures

FAQ:
What is IV in options?
Implied Volatility (IV) is the market’s forecast of how much the underlying asset is expected to move in the future.
How do you calculate IV?
IV is calculated by plugging the current option price into an options pricing model (like Black-Scholes) and solving backwards for the volatility value that makes the model price equal the market price.
In simple terms:
Option Price → Model → Output IVExplain IV vs RV
Implied Volatility (IV) = What the market expects to happen.
Realised Volatility (RV) = What actually happened in the past.
What is IV percentile?
IV Percentile measures where the current IV stands relative to its own past.
Example: If the current IV is higher than 80% of past observations, IV Percentile = 80%.What are the advantages of using implied volatility to trade?
Helps identify when options are overpriced or underpriced.
What are the drawbacks of using implied volatility to trade?
IV is only an expectation - not a guarantee.
Check some other option chains: