IV Percentile vs IV Rank: Use IVP and IVR to Identify Cheap vs Expensive Options
What is Implied Volatility Percentile (IVP)?
IV Percentile (IVP) measures the percentage of days over a specific lookback period (e.g., the past year) that the IV was lower than the current IV. It answers the question: How often has Implied Volatility been lower than it is today?
Calculation: It is the percentage of trading days in the past where the IV was lower than the current IV.
What does that mean? An IVP of 90% means that the current IV is higher than it was on 90% of the trading days in the past year. This suggests options are historically expensive.
Formula
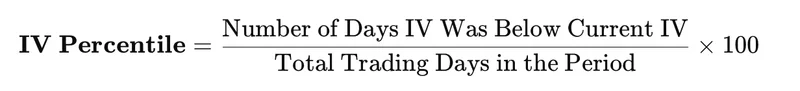
Interpretation
IVP of 0%: The current IV is the lowest it has been in the past lookback period.
IVP of 50%: The current IV is higher than 50% of the past IV readings.
IVP of 100%: The current IV is the highest it has been in the past lookback period.
If we choose the lookback period of 1-year, then an IVP of 80% means that 80% of the time over the last year, the implied volatility was lower than today's value. This suggests the current IV is relatively high.
Since IV is constantly changing, traders use metrics like IV Percentile to determine if the current IV is high or low relative to its own history.
These metrics help traders decide whether to sell premium (when IV is high) or buy premium (when IV is low).
We also explore the VRP edge every options trader must understand here.
What is Implied Volatility Rank (IV Rank)?
IVR on AlgoTest, is a normalized ranking of the current constant-maturity IV between its historical minimum and maximum over the same lookback period. IV Rank (IVR) is a metric that answers the question: Where does the current IV sit between its historical minimum and maximum?
Calculation: It is calculated on a linear scale from 0% (historical low) to 100% (historical high).
What does that mean? An IVR of 100% means the current IV is at its highest point in the lookback period, suggesting options are at their most expensive historically.
Formula

Interpretation
IVR of 0%: The current IV is at its lowest point of the past year. Options are historically cheap.
IVR of 50%: The current IV is exactly in the middle of its 52-week range.
IVR of 100%: The current IV is at its highest point of the past year. Options are historically expensive.
Traders often use a high IVR (e.g., above 50% or 70%) as a signal to sell options premium, and a low IVR (e.g., below 20% or 30%) as a signal to buy options premium.
While both metrics serve the same purpose, to contextualize the current IV, they do so differently:
Feature | Implied Volatility Rank (IVR) | Implied Volatility Percentile (IVP) |
|---|---|---|
Focus | Position within the 52-week range (High vs. Low) | Frequency of occurrence (How often IV was lower) |
Calculation | Uses only the absolute high and low IV values of the past lookback period. | Uses every IV data point in the past lookback period. |
Sensitivity | Highly sensitive to extreme, outlier high/low IV readings. | Less sensitive to outliers; provides a better measure of the typical IV environment. |
Use Case | Quick assessment of relative position. | More comprehensive view of the typical volatility environment. |
The IVP–IVR Quadrant Analysis
By splitting the IVP vs. IVR scatter into four quadrants, traders can gain a deeper understanding of the market's current state.
Check the table for IVP vs. IVR on IVP-IVR tool here.

Quadrant | IVP / IVR State | Interpretation | Implication |
|---|---|---|---|
High IVP & High IVR (Top-Right) | Volatility is extreme in both level and frequency. | Volatility has recently spiked and is near its historical maximum. | Options are highly expensive. Potential opportunities for option sellers, but with high market risk. |
Low IVP & Low IVR (Bottom-Left) | Volatility has dipped to historic lows. | Volatility is near its historical minimum and has been low for an extended period. | Premiums are low. Potential buying opportunities if a volatility pickup is expected. |
High IVP & Low IVR (Bottom-Right) | IV Percentile is high, but IV Rank is low. | A minor short-term IV uptick following a sustained low-volatility period. | Can indicate short-term buying opportunities if volatility is expected to continue rising. |
Low IVP & High IVR (Top-Left) | IV Percentile is low, but IV Rank is high. | Volatility has been elevated for an extended period relative to its history, suggesting a new, higher-volatility regime. | The current IV may appear "normal" in absolute terms but is high relative to the older baseline. |
This is Raghav's own unique formulation, this is not available anywhere else. To understand this analysis in depth, join his Discord community where he teaches all about Volatility.
To explore the tool, sign up on AlgoTest here!
You can also follow Raghav on Twitter, and to get an introduction in Volatility, come join him on his Volatility Webinar.
The Importance of Constant-Maturity IV
A critical step in calculating both IVP and IVR is the use of constant-maturity IV (e.g., 30-day). Raw option IV time series mix options with different expiries, which behave differently. Normalizing IV to a fixed time-to-expiry allows for meaningful time-series comparisons, ensuring that the IVP and IVR metrics are not comparing "apples and oranges."
Essentially IV of a 2dte option and a 25dte option behave very differently - so you can’t really compare the two directly, though they both could belong to the same monthly option. This is the reason we must use constant maturity IV, and not the raw IV when comparing IVs.
Watch Raghav's Video explaining Constant Maturity here:
Check out Raghav's thoughts on Constant Maturity on his X post here.
FAQ:
Q: What is the difference between IV Rank and IV Percentile?
A: IV Rank compares today’s IV to the range (high–low), while IV Percentile compares today’s IV to the frequency of past IV values.
Q: What is a good IV Rank for selling options?
A: Traders often ask this question, but a high IVR level alone shouldn't be reason enough to consider selling options. You should look at, IVP as well as the relative levels of realised volatility as well. Note this list is not exhaustive.
Q: What is a good IV Percentile for selling options?
A: This answer is similar to the answer above - a high IVP alone shouldn't be a reason to sell options. So anyone giving you a blanket rule of "IVP > 80%, then sell" is not your friend.
Q: Why do traders use IV Rank and IV Percentile?
A: To understand whether volatility is high or low historically, helping them choose between buying or selling options.
Q: How is IVP calculated in options?
A: IVP = % of days in the look-back period where IV was lower than today.
Q: How is IV Rank calculated in options?
A: IVR = (Current IV – 1-year IV Low) / (IV High – IV Low).
Q: Why is implied volatility important in options trading?
A: IV affects option premiums and helps traders gauge market expectations and risk.