Implied vs Realized Volatility: The VRP Edge Every Options Trader Must Understand
In the previous article, we explored Implied Volatility (IV), the market’s expectation of future volatility.
But expectations only matter when you compare them with what actually happened.
That’s where Realized Volatility (RV) comes in.
What is Realized Volatility?
Realized Volatility (RV), also known as Historical Volatility, is a backward-looking measure. It quantifies the actual, historical price fluctuation of an underlying asset over a specific past period.
Many ways to estimate the RV, most common is the annualized standard deviation of the asset's returns over the chosen lookback period (e.g., 30 days, 60 days). It represents what actually happened, in contrast to IV, which represents what the market expects to happen.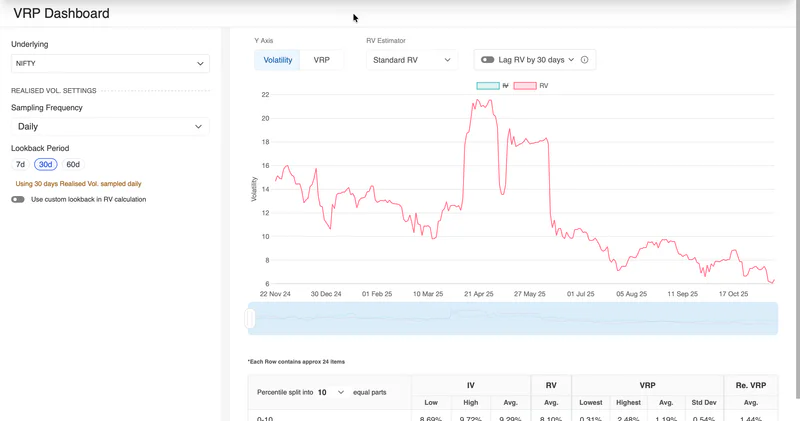
And the moment you place IV and RV side by side, you unlock one of the most powerful concepts in volatility trading: the Volatility Risk Premium (VRP).
Our VRP Tool is designed exactly for this purpose. It plots IV and RV together, highlights their divergence, and helps traders visually identify when the market is overpricing volatility, i.e., when the VRP is high.
This comparison is the foundation for understanding a potential edge in option selling.
The Volatility Risk Premium (VRP)
The Volatility Risk Premium (VRP) is the difference between Implied Volatility (IV) and Realized Volatility (RV).
Formula: VRP = IV - RV
Historically, IV tends to be higher than RV. This persistent difference is the premium that options buyers are willing to pay for "insurance" against large market moves, and it is the premium that options sellers collect for providing that insurance.
You can watch the video to see the use case of the VRP Dashboard here:
The existence of a positive VRP is the fundamental edge for strategies that involve selling options premium.
To understand this analysis in depth, join Raghav's Discord community where he teaches all about Volatility and the use case of the tools to trade smarter.
These tools came into the picture because Raghav, founder of AlgoTest, sees a gap in the trading knowledge of retail traders in India. He talks about the problem retail traders are dealing with in this article here.
Significance of VRP
The VRP is significant for two main reasons:
Risk Compensation: It compensates options sellers for the risk they take on, particularly the risk of a sudden, sharp market move (a "volatility spike").
Trading Edge: When the VRP is high, it suggests that options are overpriced relative to the actual volatility that has been experienced recently, making it a potentially opportune time to sell premium. Conversely, a low or negative VRP suggests options are cheap, potentially favouring options buying strategies.
The IV vs. RV Chart
The shown chart visually tracks the historical movement of IV (light blue line) and RV (red line) over a 60-day lookback period.
VRP in Action: When the light blue IV line is consistently above the red RV line, the VRP is positive, indicating that the market is consistently overestimating future volatility.
Trading Signal: Periods where the gap between IV and RV widens significantly (high VRP) could be seen as a good time to implement option-selling strategies.

The VRP Data Table
The table below the chart in the VRP Dashboard provides a quantitative breakdown of the VRP across different volatility environments, categorized by IV percentile splits (0-10, 10-20, etc.).
The data above confirms that, on average, IV is greater than RV both volatility environments (high and low), with the average VRP being consistently positive. This quantitative evidence supports the structural edge of collecting the VRP, on average. Note the above is sample data, and this does not mean the VRP is always positive. The above table was populated only for illustrative purposes.
Related: How to Use Option Greeks in Trading: A Practical Guide for Options Traders
Matching IV with Realized Volatility (RV)
Implied volatlity is powerful when compared to Realized Volatility (RV), the actual volatility over a past window. This comparison helps traders assess the accuracy of the market's prediction:
Option Buyers look for periods where RV > IV (market under-priced volatility).
Option Sellers look for periods where IV > RV (premiums are richly priced).
By aligning the RV lookback period with the option's days-to-expiry (DTE) and using the lag feature on AlgoTest, traders can explicitly see whether the IV prediction made in the past under- or over-predicted the actual realized volatility that followed.
Conclusion
Mastering the relationship between IV and RV is essential for any serious options trader. The VRP is a measurable, persistent market phenomenon that forms the basis of many successful trading strategies. By using tools like the VRP Dashboard to analyze the IV percentile and the magnitude of the VRP, traders can make informed decisions on when to buy or sell volatility, transforming a statistical anomaly into a consistent trading edge.
IVR & IVP can help traders understand whether volatility is high or low relative to its own past.
Check out our documentation to learn about options trading and how to use AlgoTest for it.
FAQ:
1. What is Implied Volatility (IV)?
Implied Volatility (IV) reflects the market’s expectation of future price movement. It’s derived from option prices and is a forward-looking measure.
2. What is Realised Volatility (RV)?
Realised Volatility (RV), also called Historical Volatility, measures actual price movement over a past period (like 30 or 60 days). One way to estimate it is by using the annualized standard deviation of returns.
3. What is an IV Chart?
An IV chart tracks how implied volatility moves over time. When plotted alongside Realised Volatility, it helps traders identify overpricing or underpricing of options, the foundation of VRP analysis.
4. What is the Volatility Risk Premium (VRP)?
The Volatility Risk Premium (VRP) is the difference between Implied Volatility and Realised Volatility (VRP = IV − RV). A positive VRP indicates that options are priced richer than the volatility that actually occurred, a structural edge for option sellers.
5. Why does VRP matter for traders?
Consistent presence of VRP reveals that the market tends to overestimate volatility. High VRP often signals favourable environments for premium-selling strategies, while low/negative VRP may favour option buying.
6. What is IV Percentile (IVP)?
IV Percentile shows where the current IV stands compared to past IV values.
7. What is the VRP Dashboard?
The VRP Dashboard on AlgoTest visually compares IV and RV, highlights the VRP value, and breaks it down by IV percentile ranges. It helps traders identify volatility regimes and potentially rich premium environments in the past.