How to Backtest Rolling Straddles with Indicators
Most traders hit a wall when their expertise reaches a certain level and they want to backtest complex strategies. A strategy like rolling straddles combined with indicators makes this even harder.
Where do you get a historical Straddle Chart for Nifty? How do you apply indicators like the VWAP Indicator on option structures? How do you combine signals and position management into a realistic backtest?
This is exactly where most workflows break down.
In this guide, we will cover:
What is a rolling straddle?
How to create a Straddle Chart (combined premium)?
How to use the VWAP Indicator on a Straddle Chart?
How to backtest everything properly using Signals AI on AlgoTest?
The Problem with Backtesting Option Strategies
Backtesting indicator strategies on spot charts is straightforward. Options charts are fundamentally different.
A typical trader workflow looks like this:
View an indicator on TradingView
Manually track option premiums
Approximate entries and exits
Estimate P&L
This leads to:
Inaccurate results
No way to account for real world costs and slippage
No way to test variations like rolling strikes
No access to reliable historical data
What is missing is a true Straddle Chart combined with indicator logic and position management, all in one place.
Learn how to create trading signals with AI
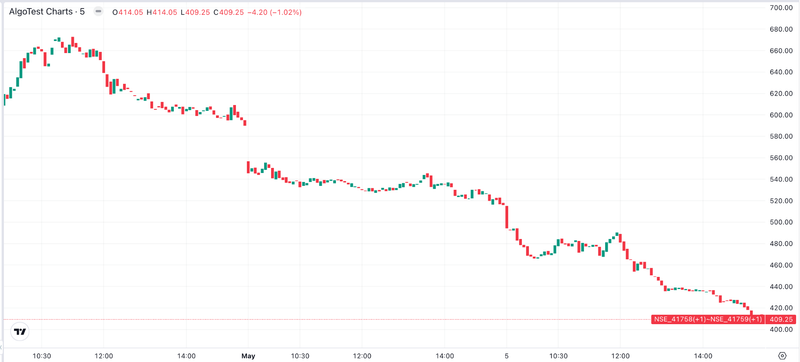
What is a Straddle Chart (Combined Premium)?
A Straddle Chart represents the combined premium of the ATM Call and ATM Put of the same expiry, recalculated continuously based on the current ATM strike. This is also called a Combined Premium Chart.
Why does this matter?
Option strategies depend on premium movement and volatility, not just spot price
Instead of analyzing the Nifty index price, you analyze the Nifty Straddle Chart, which is the combined premium behavior of the ATM straddle
What is a Rolling Straddle?
A straddle involves selling or buying both the ATM Call and ATM Put simultaneously. A rolling straddle takes this further:
The ATM strike keeps updating as the market moves
ATM is defined as the nearest strike to the spot or futures price
A consistent rounding rule is applied, for example 50 point strikes in Nifty
Why rolling matters:
Keeps the position relevant to the current market price
Captures theta decay efficiently
Adjusts dynamically with changes in prices or volatility
This is why most professional options traders prefer rolling ATM straddles over fixed ones.
Why Use the VWAP Indicator on a Straddle Chart?
Most traders apply indicators like VWAP, RSI, and EMA only on spot charts. That is a significant limitation.
When you apply the VWAP Indicator on a Straddle Chart:
You track mean reversion in the combined premium
The VWAP Indicator reflects whether the premium is trading high or low relative to its session average
You generate far more relevant entry and exit signals for options strategies
Example logic:
Entry: Combined premium closes below the VWAP Indicator
Exit: Combined premium closes above the VWAP Indicator
This is more meaningful than applying the VWAP Indicator to the spot chart alone, because the signal is grounded in actual premium behavior on the Nifty Straddle Chart.
Introducing Signals AI on AlgoTest: The Missing Layer
To solve this entire workflow, you need:
Position management
Backtesting
All in one place. This is exactly what Signals AI on AlgoTest provides.
AlgoTest is built specifically for options traders who want to move beyond manual approximation and test strategies with precision.
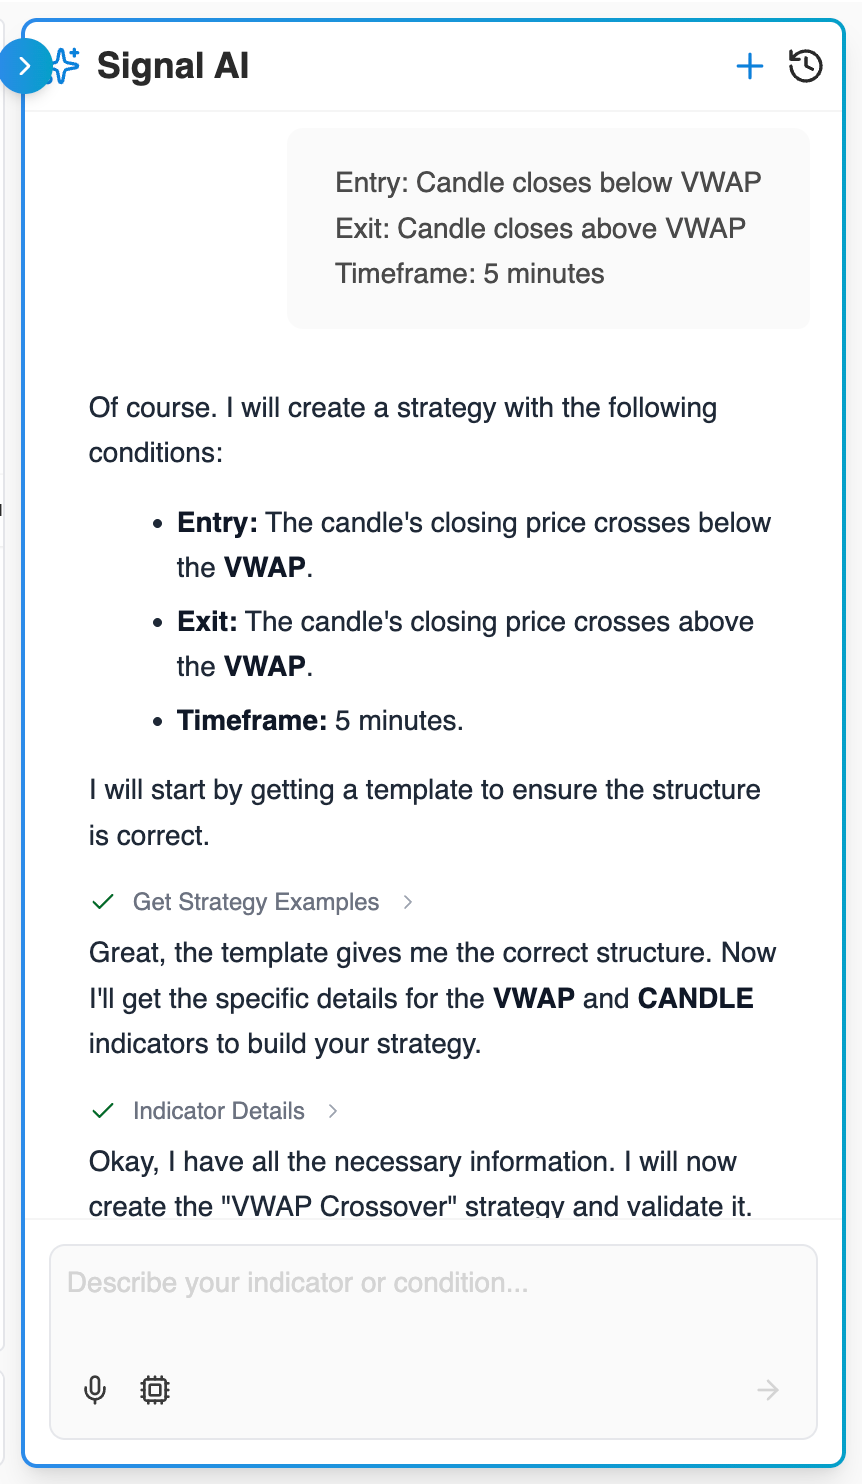
Step 1: Build Your Signals Using AI
Instead of writing code, you simply describe your logic in plain English inside AlgoTest.
Example:
Entry: Candle closes below VWAP
Exit: Candle closes above VWAP
Timeframe: 5 minutes
The AI on AlgoTest:
Understands your intent
Builds the entry and exit logic automatically
Applies the correct conditions
Eliminates manual errors and speeds up signal creation
Step 2: Create a Straddle Chart (Nifty Combined Premium)
Inside Signals AI on AlgoTest, you can:
Select Combined Premium
Choose the Straddle template
Define ATM strikes, weekly expiry, and rolling logic
The result is a real Rolling Straddle Chart for Nifty built on actual historical option data, not a spot chart.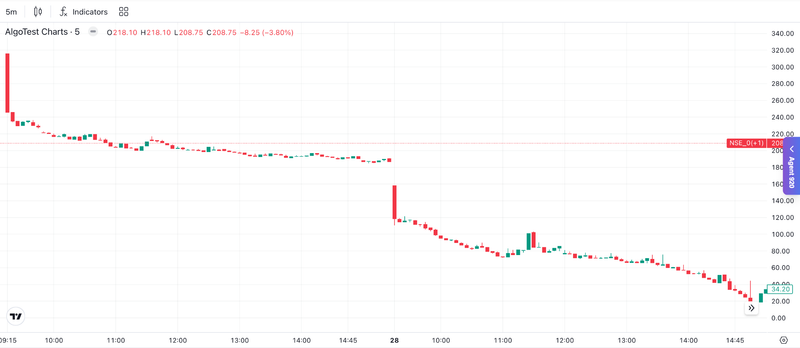
Step 3: Add the VWAP Indicator
Once the Straddle Chart is set up, you apply the VWAP Indicator directly to it.
For example:
Add the VWAP Indicator
Set a 5-minute timeframe
Your chart now becomes a Rolling Straddle Chart with a VWAP Indicator overlay. This combination of Nifty Straddle Chart and the VWAP Indicator is where real trading insights come from.
Other indicators available on AlgoTest include RSI, EMA, and Supertrend, all can applied directly to the combined premium chart.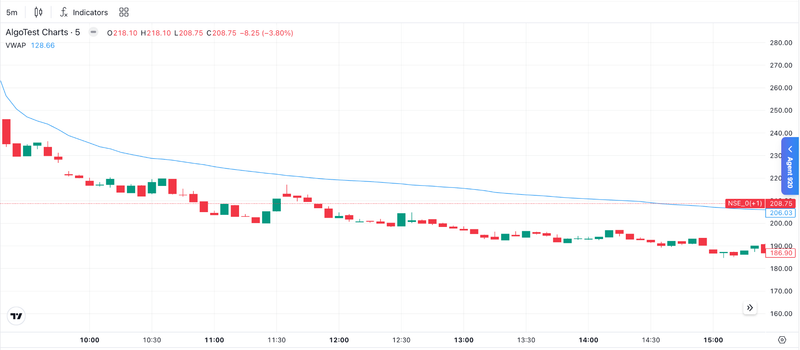
Step 4: Define Entry and Exit Conditions
AlgoTest lets you define granular conditions:
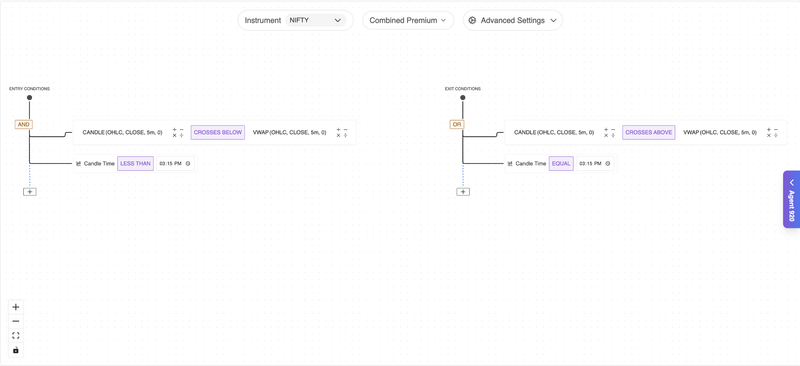
Entry Conditions
Candle closes below the VWAP Indicator
Time is before 3:15 PM
Exit Conditions
Candle closes above the VWAP Indicator
Or time equals 3:15 PM
You can also:
Add AND/OR logic
Combine multiple indicators
Set filters like maximum trades per day
Step 5: Visualize Signals on the Straddle Chart
Once your logic is defined, AlgoTest plots the entry and exit signals directly on the Straddle Chart. You can:
See exactly when signals triggered on the Nifty Straddle Chart
Analyze how often they triggered across historical data
Check whether the logic makes sense before combining with Option Strategy
This step ensures you are not guessing. You are seeing the VWAP Indicator signals firing on actual combined premium data.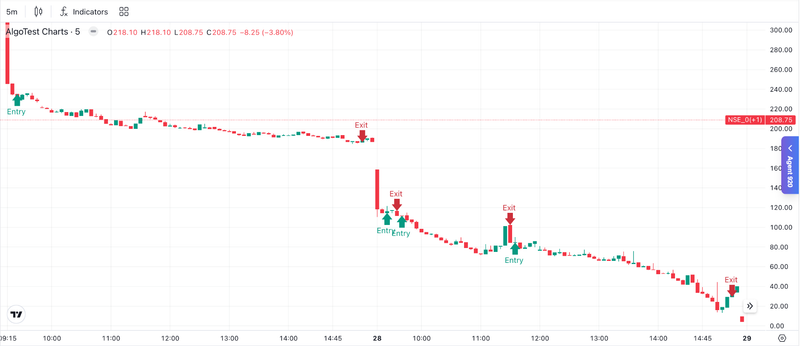
Step 6: Backtest the Option Strategy on AlgoTest
Now you connect your signal to an actual trading strategy. For example:
Sell ATM Call and Put
Add a stop loss, such as 50% on individual legs
Enable trailing stop-loss to breakeven
Then backtest on AlgoTest:
Over 1 year, 2 years, or up to the last 7 years
With slippage, brokerage, taxes, and all charges factored in
Related: How to Backtest Indicator Strategies Before Going Live
What you get:
Overall P&L
Maximum drawdown
Win rate
Risk-reward ratio
This is real backtesting, not an Excel approximation.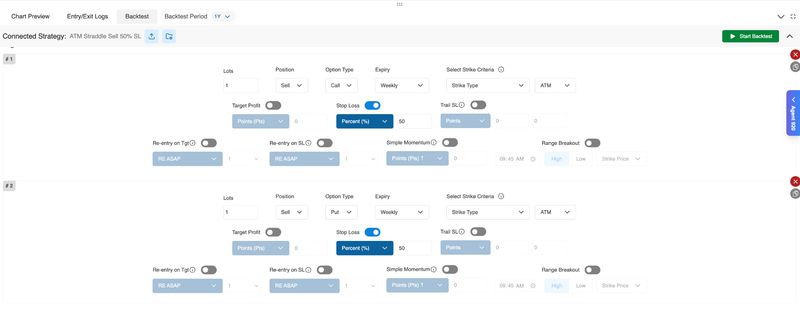
Why This Workflow Changes Everything
Traditional workflow:
Apply indicator to spot chart
Guess the trade
Manually track option premiums
Backtest in a spreadsheet or with custom code
AlgoTest workflow:
Apply the VWAP Indicator to the Straddle Chart
Generate a signal
Connect it to a strategy
Run a full backtest
All connected within a single platform.
Related Read: Best AI-Based Tradingview Alternative In India
Advanced Flexibility on AlgoTest
You can also:
Use fixed strikes instead of rolling
Change the number of trades per day
Apply filters like 0 DTE (expiry day) or specific weekdays
Test indicators beyond VWAP: RSI, Supertrend, EMA crossovers, all on the Straddle Chart.
Check out this video for more details
Key Takeaways
If you want to properly backtest option strategies:
Stop relying solely on spot charts
Use Straddle Charts built on combined premium data
Apply the VWAP Indicator to the premium, not the spot price
Combine signal generation with realistic execution and backtesting
Use AlgoTest to do all of this without writing a single line of code
Final Thoughts
The biggest gap in trading is not strategy. It is execution and validation. When it comes to options, that gap becomes even wider.
With AlgoTest's Signals AI, you can:
Build strategies using plain English
Visualize them on actual Straddle Charts
Apply the VWAP Indicator to combined premium data
Run rigorous backtests with real-world costs
All within a single platform.
If you are serious about Nifty options trading, start thinking beyond spot charts. Start thinking in Straddle Charts, VWAP Indicators, and proper backtesting on AlgoTest.