How to Automate ADX Indicator Strategy Without Coding
Most traders who use the ADX indicator already know the rules by heart. ADX above 25, +DI crosses above -DI, you enter. Clean and logical.
The problem is not understanding it. The problem is sitting there all day waiting for three conditions to line up at the same time, and then actually pulling the trigger when they do.
You miss one signal because you stepped away. You second-guess another because the move looked too fast. By the end of the week, your results look nothing like what your rules should have produced.
This guide fixes that. Here is how to automate the ADX crossover strategy on Nifty using AlgoTest Signals AI, from setting up the conditions to deploying it live, without writing any code.
Why Automating the ADX Indicator Manually Does Not Work
The ADX indicator has three components: the ADX line, the +DI line, and the -DI line. A good ADX strategy requires all three to align before you act. ADX above a threshold and a DI crossover in the right direction, both at the same time.
Monitoring all three in real time, across Nifty, BankNifty, or any stock, is harder than it sounds. You will catch some signals and miss others. Your entries will be inconsistent. And inconsistency is what kills the edge of any rule-based strategy.
The other issue is emotion. Even when you see the signal clearly, you hesitate. The market has moved a bit already. You wonder if it is too late. You skip the trade. Then it runs without you.
Automation removes all of this. Your rules fire exactly when the conditions are met, every single time, whether you are at your desk or not.
Learn how to create trading signals with AI
What You Need Before Automating the ADX Indicator Strategy
Before you touch any algo trading platform, get your rules on paper first. Not roughly. Precisely.
The ADX crossover strategy has four things you need to nail down before you build anything.
Threshold. The standard is ADX above 25. That is your minimum bar for a trend worth trading. Some traders push this to 30 to cut down on weaker signals. Either works, but pick one and do not keep changing it every time a trade does not go your way.
Entry. You go long when ADX(14) is above 25 and +DI(14) crosses above -DI(14). Both conditions need to be true at the same time. One without the other is not a signal.
Exit. You close the position when +DI(14) crosses below -DI(14). That crossover tells you the bullish move that got you in has run its course. No need to overthink the exit here, the rules are clean.
Instrument and timeframe. This guide uses Nifty cash data on a 5-minute chart. That is the same setup used in the AlgoTest Signals AI examples, so if you are following along with the screenshots, everything will line up exactly.
Once these four things are locked in, you are ready to build.
Related: 7 Bollinger Bands Strategies for Indian Markets
How to Automate Your ADX Strategy on Signals AI
Signals AI is built specifically for algo trading in India. You can automate strategies directly from a visual builder, no Pine Script, no Python, no API integration required. Everything from signal creation to backtesting to live execution happens inside one platform.
Here is the step-by-step process.
Step 1: Create a New Signal
Log into AlgoTest and open Signals AI. Click Create Signal. Name it something specific, like "ADX-Crossover-Nifty", so you can identify it easily when you have multiple signals running.
Select Nifty as your instrument and set the timeframe to 5 minutes. This matches the ADX crossover strategy example in the Signals AI documentation.
Step 2: Add the ADX Indicator
Go to Indicators, select Trend Indicators, and choose ADX. Set the period to 14. This is the default setting that Wilder originally recommended, and it works well across most Indian index instruments.
You will see three separate outputs available: the ADX line, +DI, and -DI. Each one can be used independently as a condition in your logic.
Step 3: Build Your Entry Conditions

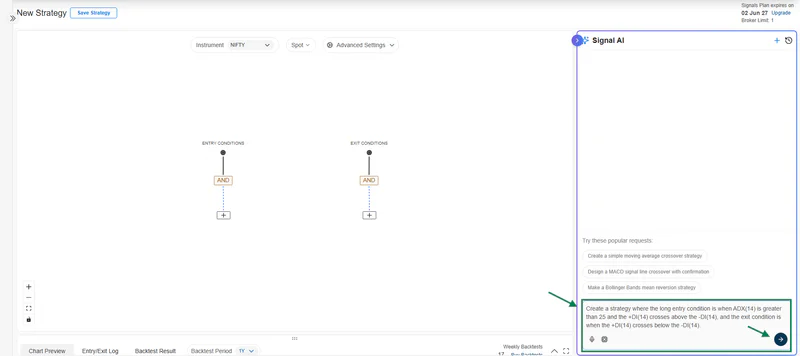
Use the condition builder to define your entry. The long entry condition from the doc is:
ADX(14) is greater than 25
AND +DI(14) crosses above -DI(14)
Both conditions must be true at the same time for the signal to trigger. The ADX filter confirms the trend is strong enough to act on. The +DI crossing above -DI confirms the direction is bullish.
You can also combine the ADX indicator with RSI or MACD for additional confirmation.
📖 Related Read Best Indicators for Options Trading in India A practical guide on which indicators pair well together for Indian options strategies.
Step 4: Build Your Exit Conditions
The exit condition for this strategy is straightforward. The long position closes when:
+DI(14) crosses below -DI(14)
That is the only exit condition in the base strategy from the doc. When +DI drops below -DI, the bullish momentum that triggered your entry has reversed. The strategy closes the position at that point.
This keeps the logic clean and easy to follow in the condition builder. Your entry and exit are mirror images of each other: you enter on a +DI crossover up, and you exit on a +DI crossover down.
Step 5: Backtest the Strategy
This is the most important step before you deploy anything live.
Run a backtest across at least 12 months of historical data. AlgoTest gives you access to years of historical data on Indian instruments, so you can stress-test across multiple market conditions, including trending phases, choppy sideways periods, and high-volatility events like Budget day or RBI policy announcements.
Look at these numbers specifically.
Win rate: ADX strategies do not need a very high win rate if the average winner is significantly larger than the average loser. Above 40 percent is a reasonable starting benchmark, not a hard rule.
Profit factor: A profit factor above 1.5 is a general benchmark worth targeting. Anything below 1 means the strategy is losing money overall.
Maximum drawdown: How deep does the strategy fall before recovering? If the drawdown is larger than you can stomach, you will shut it off at the worst possible time.
Performance in low-ADX periods: This is where most ADX indicator strategies leak. Check how the strategy performs when ADX stays below 20. If results improve significantly by filtering those periods out, add that filter to your live conditions.
📖 Related Read How to Backtest Indicator-Based Strategies on AlgoTest A step-by-step walkthrough on reading backtest results and avoiding common testing mistakes.
Step 6: Run a Forward Test (Paper Trade)
Before going live with real capital, run the strategy in Forward testing mode for two to four weeks. This is called forward testing, and it gives you a read on how the strategy behaves in current market conditions, not just historical ones.
Watch for signal frequency. If you are getting far more or far fewer signals than your backtest suggested, something in your conditions may need adjusting. Also watch for slippage. Liquid instruments like Nifty and BankNifty minimize this, but illiquid stocks can show very different live results compared to a backtest.
Check out the best Paper trading apps for Indicator algo strategies
Step 7: Deploy and Automate Live
Once your forward test results hold up, deploy the strategy live. AlgoTest connects directly to your broker, with integrations across 60 plus brokers in India including Zerodha, Angel One, and Upstox.
When the ADX conditions you defined are met, the platform fires the order automatically. You do not need to be watching the screen. You do not need to approve each trade manually. The rules run exactly as you set them up.
You can monitor live signal performance from your dashboard, adjust thresholds, pause the strategy, or run multiple signals across different instruments simultaneously.
This is what systematic algo trading in India actually looks like in practice. A defined rule set, validated on real data, running automatically without emotional interference.
Product Documentation: Signals AI
Common Mistakes to Avoid
Skipping the backtest. It is tempting to build the signal and go live immediately. Do not. An untested ADX strategy in a ranging market will bleed your account before you understand what is happening.
Setting the ADX threshold too low. ADX above 20 sounds reasonable but it lets in too many weak signals. Start at 25. Test 30. See which produces better risk-adjusted returns on your specific instrument.
Using ADX alone. ADX tells you the trend strength. It does not tell you direction or momentum. Always pair it with at least one directional filter, the DI lines at minimum, and consider adding RSI or MACD as a secondary confirmation layer.
Ignoring the timeframe. A 5-minute ADX strategy on Nifty will generate very different signals than a 1-hour ADX strategy on the same instrument. Be deliberate about which timeframe you are targeting and backtest that specific combination.
Related Read: How to backtest rolling straddles with Indicators.
Start Automating Your ADX Indicator Strategy
If you are ready to move from watching charts manually to running a system that executes for you, Signals AI on AlgoTest is where to start. Build your ADX indicator conditions, backtest them on real Indian market data, and deploy live, all without writing any code.
📖 Further Reading How AlgoTest is Simplifying Algo Trading in India
📖 Further Reading AI-Based Algo Trading in India