Nifty OI Data Explained: How to Read Open Interest Step by Step
Open Interest (OI) is one of the most widely referenced data points in Nifty options trading, yet it remains misread by many traders. Understanding what OI data is, where to find it, and how to interpret it can materially sharpen trade decisions, particularly for those who already understand the basics of options.
This article walks through the structure of Nifty OI data, how to read the option chain, and how to apply OI signals in a practical trading context.
What Is Open Interest?
Open Interest refers to the total number of active options contracts that have not yet been closed, exercised, or expired. Every options contract has two parties, a buyer and a seller. When a new contract is created between them, OI increases by one. When either party exits the position, OI decreases by one.
OI is distinct from volume. Volume counts every trade executed during a session. OI counts only the contracts still open at any given point. A high-volume day does not necessarily mean high OI, it could simply mean a lot of positions were opened and closed within the same session.
For Nifty traders, OI is significant because it reflects where money is committed across different strike prices. Large institutional participants, FIIs, proprietary desks, and hedgers tend to hold sizable positions. Where they choose to deploy capital across strikes carries directional information.
Related: How to Read Nifty Option Chain Like a Pro (with Live OI Example)
Where to Access Nifty OI Data
Nifty OI data is available on the NSE website under the Derivatives section. The primary tool is the Nifty Option Chain, which displays all active strikes for the current and upcoming expiries.
The columns that matter most for OI analysis are:
OI — total outstanding contracts at that strike
Change in OI — net increase or decrease in OI during the current session
LTP (Last Traded Price) — current premium for that option
Volume — number of contracts traded in the current session
Strikes are listed from lowest to highest in the centre column. Calls are on the left side of the table; Puts are on the right. The current Nifty spot price determines which strikes are in-the-money (ITM), at-the-money (ATM), and out-of-the-money (OTM).
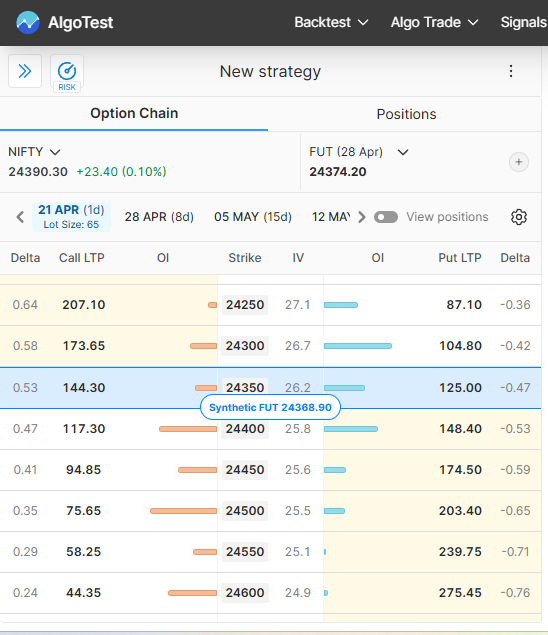
For a more advanced view with OI visualisation, real-time Greeks, and built-in analysis tools, you can use the AlgoTest Nifty Option Chain alongside your NSE data.
Read More: Getting Started with Algo Trading in Nifty Futures
The Four OI and Price Combinations
The most foundational framework in OI analysis is the relationship between price movement and OI movement. Each combination signals a different market condition.
These four scenarios apply to both the Calls and Puts side of the option chain. Reading them together gives a clearer picture of who is in control, buyers or sellers.
Here's the table in clean markdown:
Paste-ready. Works in WordPress, Notion, or any markdown-supported CMS directly.
Understanding Put-Call Ratio (PCR)
The Put-Call Ratio is calculated by dividing the total Put OI by the total Call OI across all strikes for a given expiry.
PCR = Total Put OI ÷ Total Call OI
PCR is a sentiment indicator. It reflects the relative positioning between put writers and call writers, two of the most capital-heavy participants in the market.
Interpreting PCR values:
Above 1.2 — Put writing is dominant. Sellers expect Nifty to hold or move up. Generally read as bullish market sentiment.
Between 0.8 and 1.2 — Balanced positioning. No strong directional bias from OI data alone.
Below 0.8 — Call writing is dominant. Sellers expect Nifty to remain flat or decline. Generally read as bearish sentiment.
PCR should not be used in isolation. A very high PCR (above 1.5) can sometimes indicate excessive complacency, which may precede a correction. Context - including recent price movement, VIX levels, and upcoming events always matters.
Also read: Sensex Option Chain Explained: How to Read, Analyse & Trade Using Live Data
How to Identify Support and Resistance Using OI (Nifty Option Chain Analysis)
The strike with the highest Put OI is commonly referred to as the Put Wall or OI-based support. The logic: put writers at that strike have a financial interest in Nifty staying above that level. They tend to defend it by adding to their positions as Nifty approaches.
The strike with the highest Call OI is the Call Wall or OI-based resistance. Call writers at that strike benefit from Nifty closing below it at expiry. This concentration of selling pressure acts as a ceiling.
Practical example: If Nifty is at 24,050 and the highest Call OI sits at the 24,200 CE while the highest Put OI sits at 23,800 PE, the implied OI range for the week is 23,800–24,200. Nifty often gravitates toward the centre of this range heading into expiry — a concept related to max pain theory.
This range shifts intraday as OI changes. Monitoring Change in OI, not just absolute OI, allows traders to detect when a wall is being reinforced or broken down.
Want to see how OI walls interact with your options strategy before placing a trade? The AlgoTest Strategy Builder lets you visualise how OI positioning at specific strikes impacts your payoff, Greeks, and probability of profit — in real time, with no coding required.
Reading Change in OI: The Most Important Column
Absolute OI shows where positions exist. Change in OI shows what is happening right now.
If the 24,200 CE has an absolute OI of 90 lakh contracts but a Change in OI of −15 lakh, it means call sellers at that level are exiting. The wall is weakening. If Nifty is simultaneously rising toward 24,200, this is a potential breakout setup — sellers are unwinding, which reduces the overhead resistance.
Conversely, if Change in OI is strongly positive at a strike while price approaches it, the wall is being reinforced. Sellers are adding to their positions. In this scenario, the level is more likely to hold.
This dynamic is most visible in the final 90 minutes of an expiry session, when positions are adjusted rapidly.
Expiry Thursday: A Step-by-Step Nifty OI Scenario
On weekly expiry days (Thursday for Nifty), OI data becomes particularly actionable. By 2:00 PM, most large participants have decided whether to roll positions or let them expire.
Consider this scenario: Nifty opens at 24,100 on expiry Thursday. The Call Wall at 24,200 CE holds 80 lakh contracts. The Put Wall at 24,000 PE holds 65 lakh contracts. PCR is 1.1, mildly bullish.
By 11:30 AM, the 24,200 CE shows a Change in OI of −12 lakh. Call sellers are buying back their positions. At the same time, Nifty pushes toward 24,180 with above-average volume on Nifty futures.
This combination - declining OI at the Call Wall, price moving toward the level, and above-average volume- is often a precursor to a breach. Traders tracking a change in OI would have this context well before the breakout confirmed on the price chart.
Key Metrics to Check Before the Session Opens
A structured pre-market OI review takes under 10 minutes and covers five inputs:
Overall PCR — establishes the directional bias for the day
Call Wall and Put Wall strikes — identifies the implied trading range
Nifty spot vs. the walls — determines proximity to key OI levels
ATM strike Change in OI from prior close — shows overnight institutional positioning
India VIX — elevated VIX (above 15–16) increases hedging activity, which can distort OI signals
These five data points give a foundational view before charts are even opened.
Read More: Bank Nifty Expiry Day Explained (2026): Date, Rules & Best Strategies
Common Errors in OI Analysis
Using absolute OI without tracking Change in OI
A strike with large OI that hasn't moved in three sessions may reflect stale positioning. What matters is fresh movement — new additions or exits happening today.
Treating OI signals as standalone trade triggers
OI data reflects positioning, not certainty of direction. It must be read alongside price action, volume, and volatility before a trade decision is made.
Ignoring expiry context
OI dynamics behave differently on expiry day versus three weeks before expiry. Near expiry, positions are squared off rapidly and key levels shift faster. Applying a mid-series OI read to an expiry-day setup leads to misinterpretation.
Validate Your OI-Based Strategy Before Going Live
Reading OI is the first step. The second is testing whether an OI-based strategy would have worked historically before committing real capital.
The AlgoTest Backtester lets you run multi-year simulations on Nifty options strategies with real slippage, brokerage, and taxes included. If you've built an approach around PCR levels, Call Wall breakouts, or expiry-day OI shifts, you can quantify its historical edge in seconds, not days.
Start backtesting free — 25 backtests per week, no credit card required.
Start Using Nifty OI Data in Your Trading Routine
Nifty OI data is freely available on NSE and requires no paid subscription to access. The skill lies in reading it consistently, tracking Change in OI in real time, cross-referencing PCR, and confirming with price-volume action before acting.
For intermediate traders, building a daily pre-market OI habit is the most practical starting point. Over time, what looks like noise starts to reveal clear patterns: where institutions are positioned, which levels are genuinely defended, and where a move has real momentum behind it versus where it's likely to stall.
Once you have read, the next step is stress-testing it. The AlgoTest Strategy Builder lets you visualise how your OI-based setup interacts with your payoff and Greeks before placing a trade. Pair that with the AlgoTest Backtester to quantify the historical edge of your full strategy across multiple years of Nifty data, with slippage and brokerage factored in.
Options trading involves significant market risk. OI analysis is one input in a broader decision-making process. Past patterns in OI data do not guarantee future price outcomes.