How to Interpret a Backtested Portfolio's Aggregate Results
This will be a short blog post on interpreting a backtested portfolio's aggregate results on AlgoTest.
Backtesting a Portfolio
We released a blog post a few weeks ago that explained how AlgoTest defines a portfolio, and how you can add create a portfolio and backtest it. You can check out the post here.
In short, a user can group different saved strategies into a portfolio and view their combined backtest result. Previously, we showed the combined backtest results on a "Per Trade" basis. In the last week, we've released a new feature that also allows you to view the portfolio on a "Per Day" basis for an intraday portfolio, and a "Per Holding Period" basis for an mixed portfolio. A mixed portfolio here just means a portfolio that includes a combination of intraday and positional strategies.
Interpreting a Backtested Portfolio's Aggregate Results
"Per Trade" Basis
"Per Trade" means exactly what it sounds like - we treat every trade of each strategy in the portfolio as a standalone trade, and then calculate the results. You can view this by unchecking this box that says "Aggregate At End of Trading Day" located right above your portfolio results:

Here is a screenshot from the google sheet we shared with you.
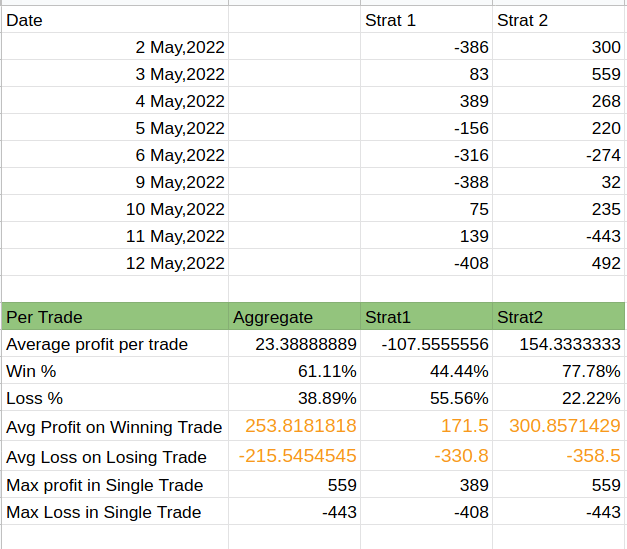
You can observe in the above image that there are 9 trading days with 2 strategies in the portfolio. When we aggregate on a "Per Trade" basis, we will consider these as 18 separate data points to calculate our "Aggregate" column.
Let's calculate the Win% and Loss% as an example here. There are 7 trades that show a loss in the above image (5 in Strat 1 and 2 in Strat 2). Therefore, there are 11 winning trades, which means our Win% = 11/18 = 61.11%, and our Loss% = 7/18 = 38.89%.
"Per Day" Basis
When aggregation is done on a "Per Day" basis, then each individual day's result is summed to arrive at a "Daily PnL" figure. We then calculate the combined results using this newly calculated "Daily PnL" figure. Here's another screenshot from our sheet again.
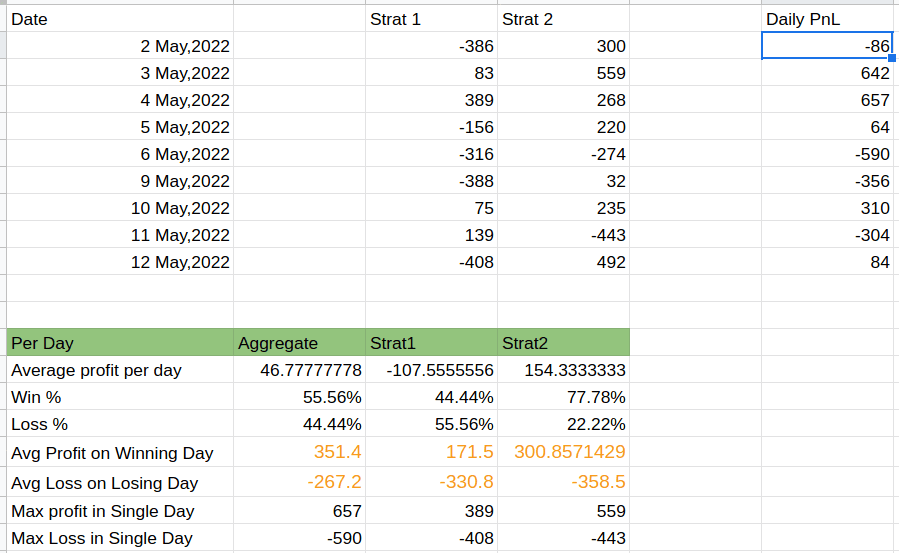
We use this Daily PnL column to calculate our portfolio results. Let's calculate the Win% and Loss% again.
In the previous calculation, we had 18 total data points. This time we have only 9, as we had only 9 trading days. We had 4 losing days and 5 winning days out of these 9 trading days. You can observe this in the "Daily PnL" column on the right side in the image above. So Win% = 5/9 = 55.56%, and Loss% = 4/9 = 44.44%.
You can toggle this view by checking this on AlgoTest above the Portfolio results:

What about Positional Strategies?
Next, lets assume our portfolio consists of a positional and an intraday strategy, where the positional strategy is closed every weekly expiry day.
The "Per Trade" scenario calculation will stay the same in this case. However, the "Per Day" scenario will now be interpreted as "Per Holding Period". The max holding across all strategies in this case is the holding period of the positional strategy, which is weekly. For context, the holding period of an intraday strategy is daily, since we square off our intraday position everyday.
In this case, when a user selects "Aggregate at End of Trading Day" (i.e. "Per Day" basis), our Win% and Loss% will now become a Weekly Win% and Loss%. Here is the screenshot of this calculation:
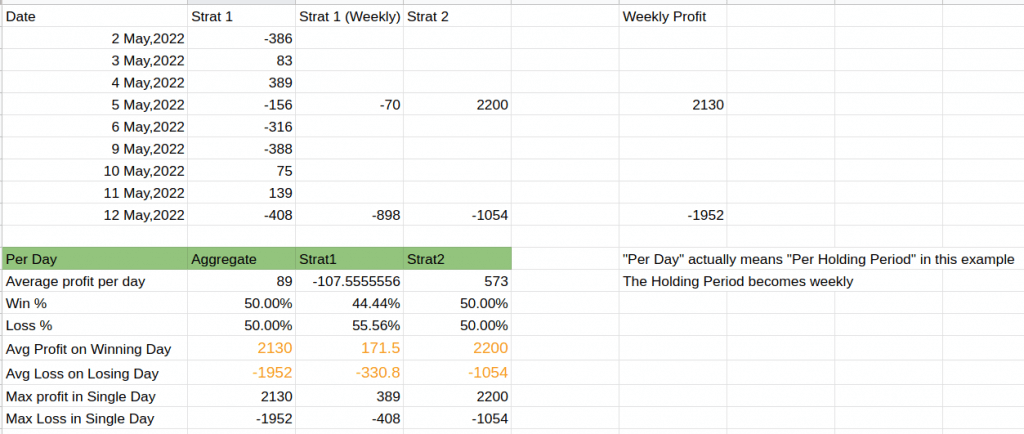
The new column to note here is the column titled "Strat 1 (Weekly)". To calculate this, we just added the individual daily profit or loss of Strat 1. As of 5 May, Strat 1 had made a loss of Rs 70, and Strat 2 had made a profit of Rs 2200. Thus, the combined weekly profit of the strategy is -70 + 2200 = Rs 2130.
Similar calculation is done for the next week, and we now have 2 data points on which we calculate our Win% and Loss%. Since we made a profit in our first week, and made a loss in our second week, our Win% = Loss% = 50% in this case.
The fields Avg Profit on Winning Day, Avg Loss on Losing Day etc. is now interpreted as "Avg Profit on Winning Week", "Avg Loss on Losing Week", etc.
Here's a short video explaining this as well:
Portfolio Result Aggregation Demo