Margin Calculator by AlgoTest
Introducing AlgoTest's Margin Calculator
AlgoTest is thrilled to introduce our latest feature: the Margin Calculator. In the ever-evolving landscape of trading, having precise knowledge of your margin requirements is paramount. Our margin calculator is designed to empower traders by providing instant and accurate margin computations, ensuring you always maintain optimal capital allocation. This significant update is a testament to AlgoTest's commitment to offering tools that streamline the trading process, reinforcing our goal to keep traders one step ahead in the competitive market environment.
Margins play a dual role as both a safeguard for brokers and a requisite for traders. But what exactly encompasses a margin, and how does it intersect with the trader's journey? Let's discuss this.
Margin and Pledging
The Mathematical Precision of Margin
In trading, Margin is not just a term; it's a calculated value, representing the capital required to open a specific trading position. It’s computed as a percentage of the total contract value of the positions. This mechanism provides the leverage every trader seeks.
Let’s dissect the mechanism with Nifty:
Nifty is currently trading at : 19500
NIFTY lot size = 50
Buy 1 lot of Nifty
Current Margin Requirement: Precisely 1.1L
The Notional Exposure : A calculated 9.7L
By fronting about 10% of the total value (1.1L), traders are granted authority over a 9.7L position, reflecting the essence of margins.
Bear in mind, margin values aren't static. They adapt to the market's volatility and are re-evaluated three times daily to align with the current market trends and risks.
The Dual Components: SPAN & Exposure
i. SPAN Margin: SPAN, an acronym for Standard Portfolio Analysis of Risk, is the industry's adopted risk metric. It quantifies the worst potential loss that a trader's portfolio might face within a trading day, based on a collection of risk variables. While SPAN seems like a protective mechanism, its real intent is to shield the broker, and the ecosystem itself from unforeseen market downturns.
ii. Exposure Margin: This is like your tax surcharge, extra on top of your SPAN margin.
It ensures that the broker remains insulated from losses that might exceed the SPAN projections, typically factoring in about 2-3.5% of the contract value.
Pledging: The Alchemy of Trading
Pledging is the strategic manoeuvre where traders can use their securities as collateral, pledging them with their broker in exchange for margin. However, this margin incurs a certain deduction known as a 'haircut'. And while pledging offers an opportunity, a rule remains: at least half the margin should stem from cash or its equivalents.
To understand this issue a little better, you can read this interesting piece or this one to understand how the crude episode affected brokerage businesses in India.
How does it affect the trader?
Armed with the knowledge of margins and pledges, traders are empowered to:
- Amplify their trading positions with calculated risks.
- Formulate strategies grounded in technical precision.
- Optimise their assets with the art of pledging.
- Still lose money while trading hehe (unless you’re trading on AlgoTest double hehe)
While the mathematical intricacies of margins and pledges may seem daunting, tools like AlgoTest's Margin Calculator bridge the gap, granting traders clarity and confidence in their endeavours.
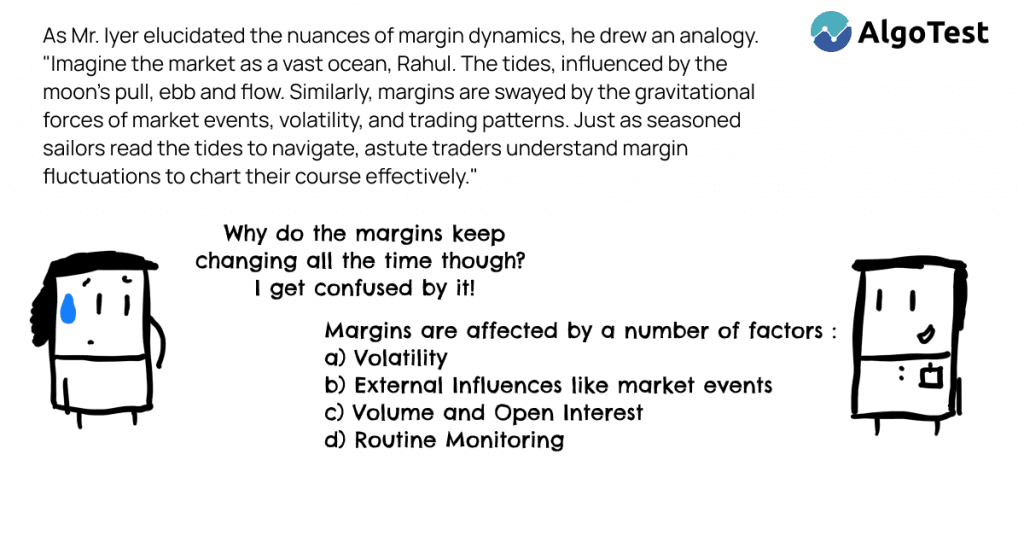
The Fluidity of Margins: Why Do They Change Intraday?
The trading world, much like our own, is in a constant state of flux. Prices of securities oscillate, market sentiments shift, and global news can instigate sudden spikes or drops in prices and volatility. Margins are tethered to these variables, acting as a reflection of the prevailing market conditions.
a) The Role of Volatility:
Volatility, a measure of price fluctuations, plays a central role in margin adjustments. High volatility translates to increased price unpredictability, prompting exchanges to hike margin requirements. This acts as a safety net, cushioning against potential losses due to erratic price movements.
b) External Influences:
Global events, such as geopolitical tensions, major economic announcements, or unexpected financial results, can influence trading environments significantly. Exchanges might adjust margins in anticipation of or in reaction to such events to protect the market's integrity.
c) Volume & Open Interest:
An abrupt surge in trading volume or a change in open interest – the total number of outstanding contracts – can signal potential price movements. Exchanges often use these indicators as a barometer to tweak margin requirements.
d) Routine Monitoring:
Exchanges actively monitor trading activities. Margin requirements are recalibrated thrice daily based on market data and risk assessment metrics. These evaluations are in place to ensure that traders and brokers operate within a protective framework, mitigating default risks.
SPAN Margin - A Closer Look
SPA, or Standard Portfolio Analysis of Risk, is a pivotal concept in the trading world. Used by exchanges and brokers alike, it serves a vital function:
Purpose: To calculate the total risk associated with a specific portfolio.
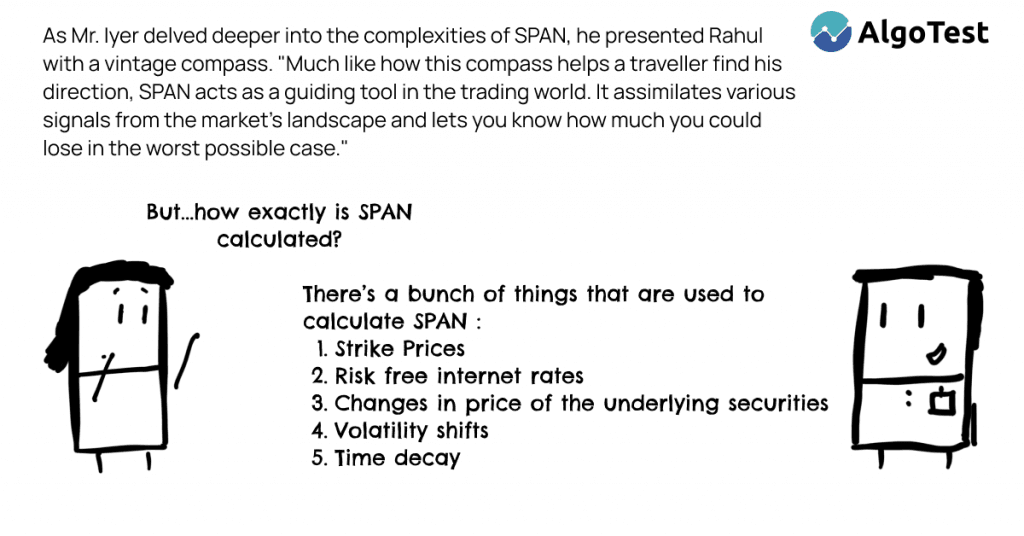
But how does it accomplish this? SPAN takes into consideration a range of parameters to ensure a comprehensive risk assessment. Here's a breakdown:
- Strike Prices: These are predetermined prices at which a trader can buy or sell a security.
- Risk-free Interest Rates: This represents the return on a theoretically risk-free investment, like a government bond.
- Changes in Prices of the Underlying Securities: As securities' prices fluctuate, the inherent risk associated with them can shift.
- Volatility Shifts: Market or security-specific volatility can alter the potential for unexpected price movements.
- Time Decay: The decrease in an option's value as it approaches its expiration date.
Armed with insights from these parameters and more, SPAN meticulously calculates potential risks, preparing traders and brokers for various market scenarios.
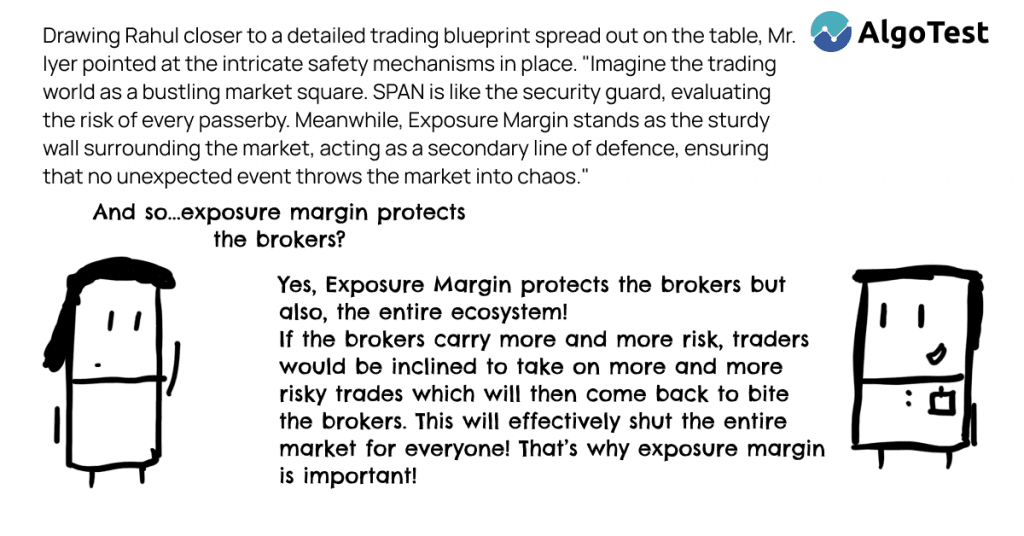
Exposure Margin - Decoding the Safety Net
Beyond SPAN lies another layer of calculated protection: the **Exposure Margin**. While SPAN handles the risk assessment, Exposure Margin steps in as an additional protective buffer.
Purpose: To shield against potential losses that might exceed what SPAN has identified and quantified.
But what exactly dictates the parameters of this buffer? Let’s break it down:
- Nature of Calculation: The system meticulously predicts the gravest one-day loss an account might face by considering a spectrum of potential market scenarios. Out of these projections, the largest conceivable loss becomes the mandated margin requirement.
- Additional Safety: This margin is essentially an extra amount that brokers require, over and above the SPAN margin.
- Typical Rates: Generally, the Exposure Margin is set at about 2% of the contract value, pertinent to futures trades and short option trades. But, why precisely 2%?This is a number determined by the exchanges after considering a multitude of reasons like risk management, liquidity considerations, regulatory requirements and so on. Perhaps, 2% is considered the right balance between protecting speculators from overleveraging whilst still allowing them to participate in the markets.
Looking at historical data, interestingly we can see that an intraday 2% move in the Nifty 50 lies slightly below the 90th percentile.
- Stock Specifics: For stock futures and short options, the equation alters slightly. Here, the Exposure Margin is the greater of two values: either 3.5% of the contract value or 1.5 times the standard deviation of the logarithmic returns of the pertinent share over the past half-year – whichever is higher.
For clarity, let's dive into an illustrative example using Reliance Industries (RIL) futures:
- Spot Price: Rs 2,339
- Lot Size: 250
- Contract Value Calculation: Spot Price × Lot Size = Rs 2339 × 250 = Rs 5,84,750
Now, taking 3.5% of this Contract Value, we get Rs 20,465.
However, considering the logarithmic returns, if we assume a 10% standard deviation (SD) for the past 6 months, then:
- 1.5 times the SD = 1.5 × 10% = 15%
- 15% of the Contract Value = Rs 87,712
This means a trader could potentially be looking at two Exposure Margins: either Rs 87,712 or Rs 20,465. Since the exchange considers the higher value of the two, the exposure margin in this case will be Rs 87,712.
Pledging - Maximising your Trading Potential
Pledging provides traders an avenue to leverage their assets more optimally, especially when they have faith in their derivatives trading strategy. So, what's the science and art behind it?
1. The Pledging Mechanism:
- Concept: Traders, instead of solely depending on cash for trading, have the choice to invest their money in marketable securities. These securities can then be pledged, offering them an interest-free loan for their trading ventures.
- Process: The securities are pledged with the depository via the trader's broker, which, in return, provides a margin in the trader's broking account.
- Haircut: An essential term in the pledging realm, 'haircut' refers to a specific deduction from the pledged value. This deduction varies since different assets come with distinct risk levels, influenced by factors such as historical price movements and volatility. The riskier the asset you’re pledging, the higher the haircut. Click here to see Zerodha’s comprehensive list of instruments and the respective haircuts they levy.
- Pledging in Action: Picture owning 100 shares of HDFC bank. If the Last Traded Price (LTP) is Rs 1510, the total investment stands at 1.51L. Assuming a haircut of 12.5% for this stock, the margin made available for trading would be Rs 1,32,125.
2. Critical Caveats to Consider:
- 50% Cash Rule: Post the haircut, while initiating a trade, traders need to ensure at least half of the required margin originates from cash or its equivalent.
- Why this Rule?: This is designed to cap a trader's leverage to a maximum threshold of 2.
- Cash Equivalents Explained: These are securities pledged with the broker, treated almost at par with cash when considering the margin. While they undergo a haircut, the margin they provide is treated as cash in the 50% cash rule. Some popular examples include Liquid Bees ETF, MOGSEC, and liquid funds like the Axis liquid fund.
3. Pledging Constraints:
- All Securities Aren't Pledge-Friendly: There's a cap on the quantity of individual securities one can pledge with the clearing corporation. Surpassing this threshold is a no-go.
- The VaR Factor: Value at Risk (VaR) quantifies the maximum potential loss an asset might incur over a specified timeframe, at a certain confidence level. For instance, a stock with a 100% VaR suggests that the anticipated loss could be equivalent or surpass its current market value, within a given confidence interval. Such stocks are ineligible for pledging.